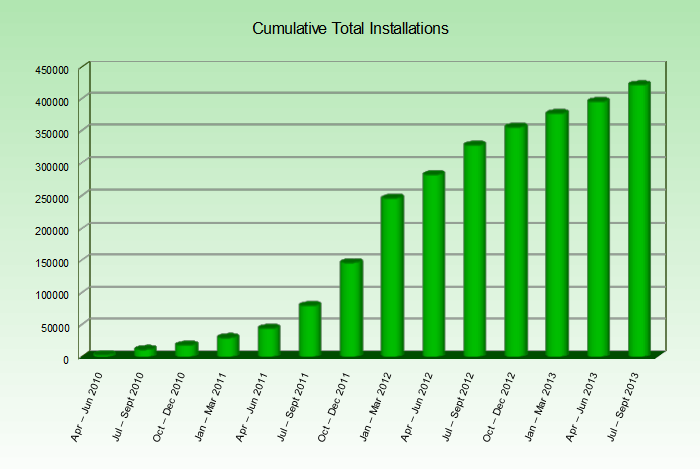
September 2013 saw installations under the UK Feed in Tariff scheme reach 421,963 and a total installed capacity of 2,088.62 MW. The third quarter of 2013 had 25,959 installations accounting for 171.16 MW of added renewable energy generation capacity.
Note: This report analyses Feed in Tariff data on confirmed installations up to 30th September 2013. The data analysed is based on confirmation date data from Ofgem’s Renewables & CHP Register.
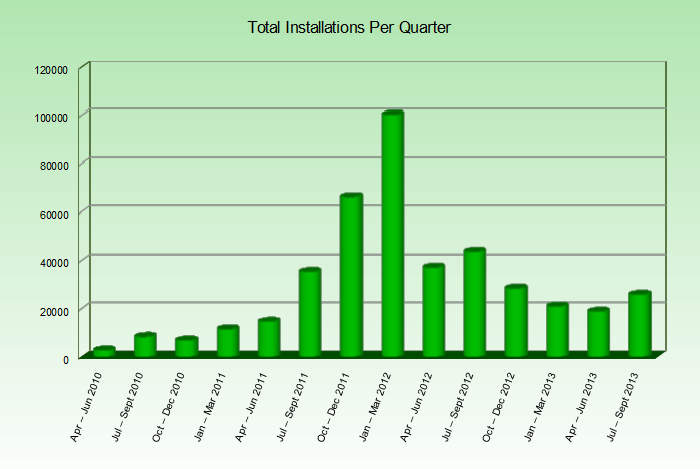
Growth in Installation Numbers Accelerates
Growth in installation numbers has increased this quarter. Q3 2013 saw 25,959 installations compared to 18,927 in Q2. This is a welcome sign after the previous three quarters had shown consecutive declines in the number of new installs.
Solar PV remains far and away the largest technology in the FiT scheme and 25,775 new installations is welcome growth after a series of slow quarters. The number of new wind installations continued to fall with 142 installations this quarter but despite this, wind managed a very strong quarter in terms of installed capacity.
Quarterly Installations by Technology
| Solar PV | Wind | Hydro | Micro CHP | Anaerobic digestion | Total | |
|---|---|---|---|---|---|---|
| Apr – Jun 2010 | 2,690 | 59 | 4 | 0 | 0 | 2,753 |
| Jul – Sept 2010 | 7,707 | 604 | 105 | 5 | 0 | 8,421 |
| Oct – Dec 2010 | 6,594 | 308 | 45 | 17 | 2 | 6,966 |
| Jan – Mar 2011 | 11,206 | 292 | 41 | 78 | 1 | 11,618 |
| Apr – Jun 2011 | 14,450 | 179 | 12 | 58 | 2 | 14,701 |
| Jul – Sept 2011 | 35,027 | 307 | 16 | 97 | 4 | 35,451 |
| Oct – Dec 2011 | 65,891 | 233 | 11 | 68 | 4 | 66,207 |
| Jan – Mar 2012 | 99,911 | 315 | 22 | 36 | 2 | 100,286 |
| Apr – Jun 2012 | 36,728 | 431 | 31 | 14 | 5 | 37,209 |
| Jul – Sept 2012 | 43,319 | 415 | 34 | 31 | 9 | 43,808 |
| Oct – Dec 2012 | 27,826 | 683 | 16 | 20 | 7 | 28,552 |
| Jan – Mar 2013 | 20,549 | 507 | 19 | 19 | 11 | 21,105 |
| Apr – June 2013 | 18,707 | 175 | 25 | 15 | 5 | 18,927 |
| July – Sept 2013 | 25,775 | 142 | 23 | 9 | 10 | 25,959 |
| Total | 416,380 | 4,650 | 404 | 467 | 62 | 421,963 |
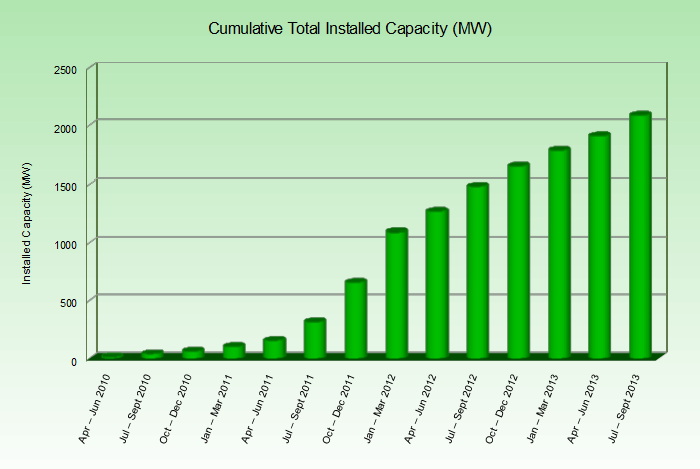
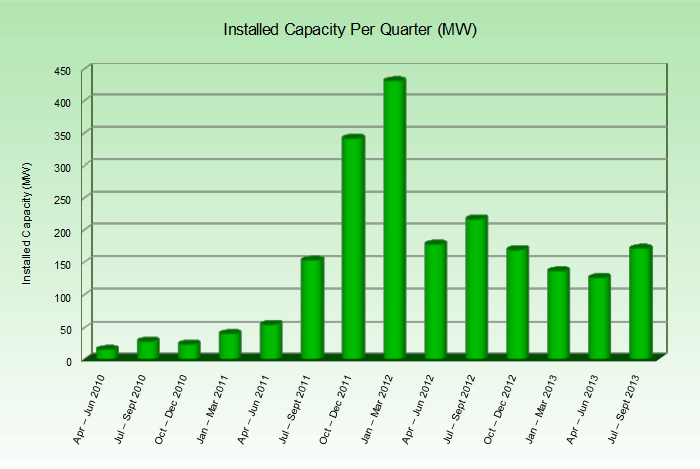
Installed Capacity
Installed capacity under FiT continues to grow steadily. Q3 2013 saw 171.16 MW of installed capacity added across all technologies making it the strongest quarter since September 2012. Wind, which saw only 142 installations in the quarter, added 23.15 MW of capacity, continuing a trend of larger installs. This is wind’s second strongest quarter for installed capacity since the start of the scheme despite the low number of installs.
Quarterly Installed Capacity (MW) by Technology
| Solar PV | Wind | Hydro | Micro CHP | Anaerobic digestion | Total | |
|---|---|---|---|---|---|---|
| Apr – Jun 2010 | 6.64 | 5.25 | 3.27 | 0 | 0 | 15.16 |
| Jul – Sept 2010 | 19.44 | 5.11 | 3.73 | 0.01 | 0 | 28.29 |
| Oct – Dec 2010 | 18.51 | 2.77 | 1.68 | 0.02 | 0.67 | 23.64 |
| Jan – Mar 2011 | 32.80 | 5.39 | 1.08 | 0.08 | 1.10 | 40.45 |
| Apr – Jun 2011 | 43.65 | 5.22 | 2.91 | 0.06 | 3.19 | 55.04 |
| Jul – Sept 2011 | 142.38 | 3.90 | 2.57 | 0.10 | 3.85 | 152.80 |
| Oct – Dec 2011 | 329.55 | 6.73 | 2.72 | 0.07 | 2.81 | 341.87 |
| Jan – Mar 2012 | 405.36 | 20.00 | 3.79 | 0.04 | 2.07 | 431.25 |
| Apr – Jun 2012 | 154.02 | 16.10 | 3.72 | 0.01 | 4.01 | 177.86 |
| Jul – Sept 2012 | 185.88 | 17.00 | 5.14 | 0.04 | 9.12 | 217.16 |
| Oct – Dec 2012 | 146.92 | 14.23 | 3.55 | 0.02 | 4.56 | 169.28 |
| Jan – Mar 2013 | 98.44 | 31.34 | 0.96 | 0.02 | 6.80 | 137.57 |
| Apr – June 2013 | 99.51 | 17.62 | 2.24 | 0.02 | 7.70 | 127.08 |
| July – Sept 2013 | 139.89 | 23.15 | 1.75 | 0.01 | 6.36 | 171.16 |
| Total | 1,823.00 | 173.80 | 39.11 | 0.48 | 52.24 | 2088.62 |
Renewable Installations by Technology
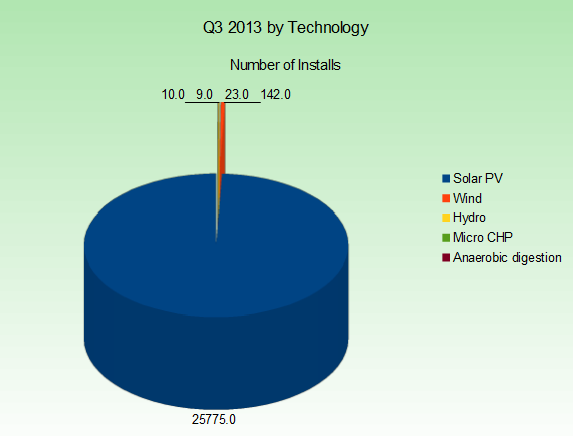
Q3 2013 (July – Sept)
When looking at installation numbers, solar PV remains by far the dominant FiT technology, as it has been since the beginning of the scheme. The number of wind installs has dropped to a low not seen since 2010 but installed capacity was very strong.
| Technology | Number of Installs |
|---|---|
| Solar PV | 25,775 |
| Wind | 142 |
| Hydro | 23 |
| Micro CHP | 9 |
| Anaerobic digestion | 10 |
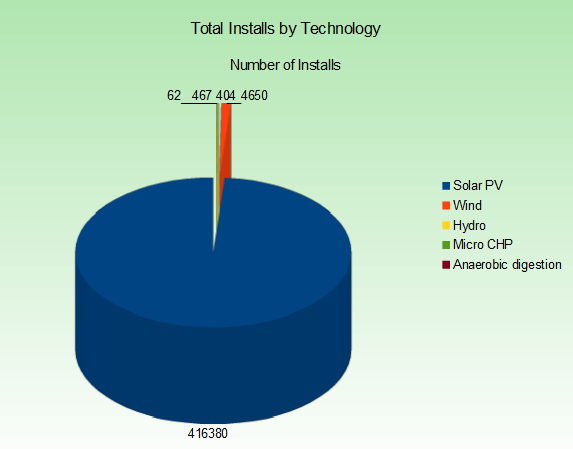
All Time
| Technology | Number of Installs |
|---|---|
| Solar PV | 416,380 |
| Wind | 4,650 |
| Hydro | 404 |
| Micro CHP | 467 |
| Anaerobic digestion | 62 |
Renewable Generation Capacity by Technology
Q3 2013 (July – Sept)
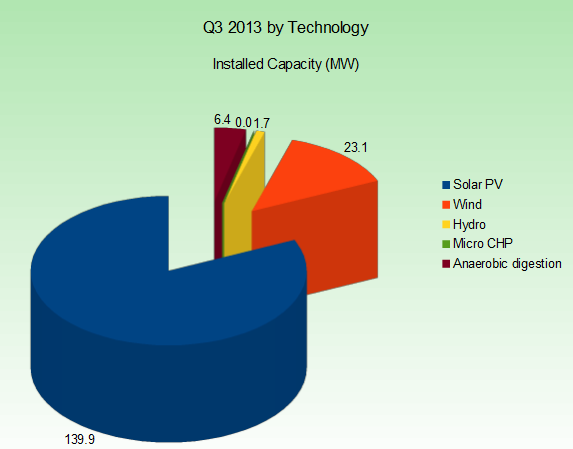
| Technology | Installed Capacity |
|---|---|
| Solar PV | 139.89 MW |
| Wind | 23.15 MW |
| Hydro | 1.75 MW |
| Micro CHP | 0.01 MW |
| Anaerobic digestion | 6.36 MW |
All Time
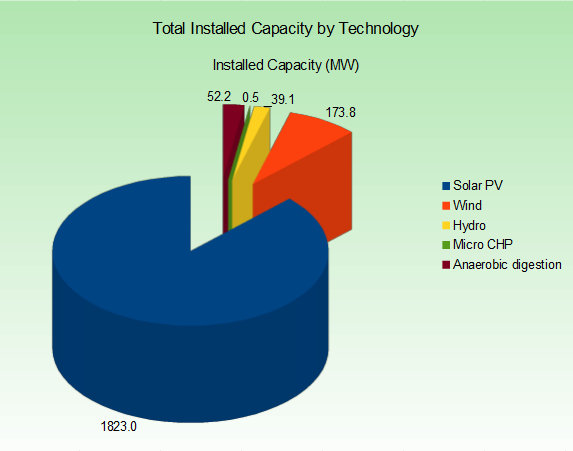
| Technology | Installed Capacity |
|---|---|
| Solar PV | 1,823.00 MW |
| Wind | 173.80 MW |
| Hydro | 39.11 MW |
| Micro CHP | 0.48 MW |
| Anaerobic digestion | 52.24 MW |
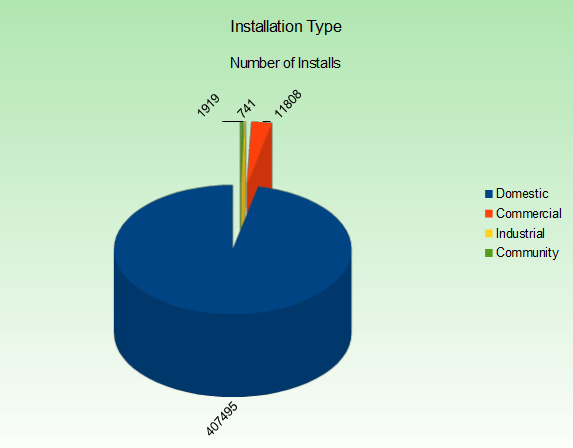
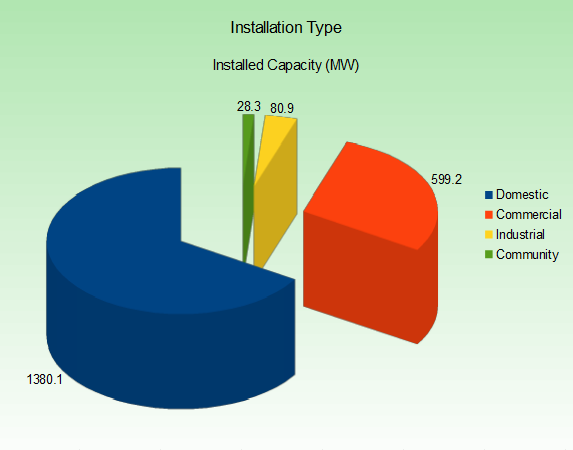
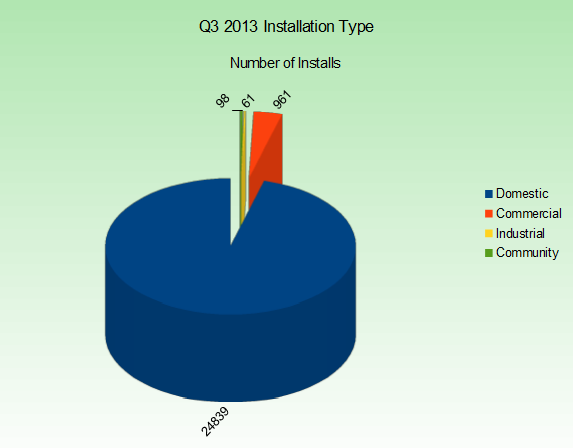
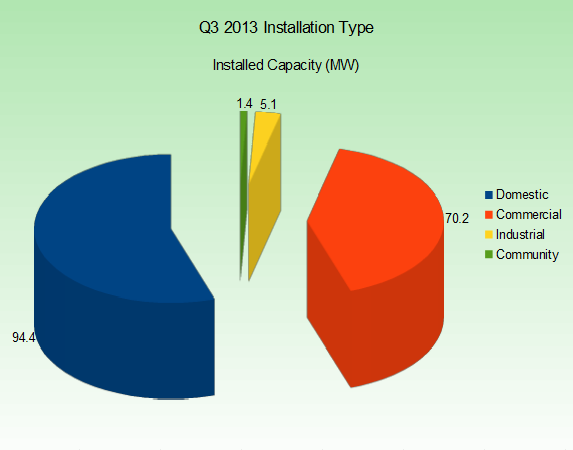
Domestic vs Non-domestic
Q3 2013 (July – Sept)
| Number of Installs | Installed Capacity (MW) | |
|---|---|---|
| Domestic | 24,839 | 94.44 |
| Commercial | 961 | 70.19 |
| Industrial | 61 | 5.13 |
| Community | 98 | 1.39 |
All Time
| Number of Installs | Installed Capacity (MW) | |
|---|---|---|
| Domestic | 407,495 | 1,380.10 |
| Commercial | 11,808 | 599.25 |
| Industrial | 741 | 80.92 |
| Community | 1,919 | 28.35 |