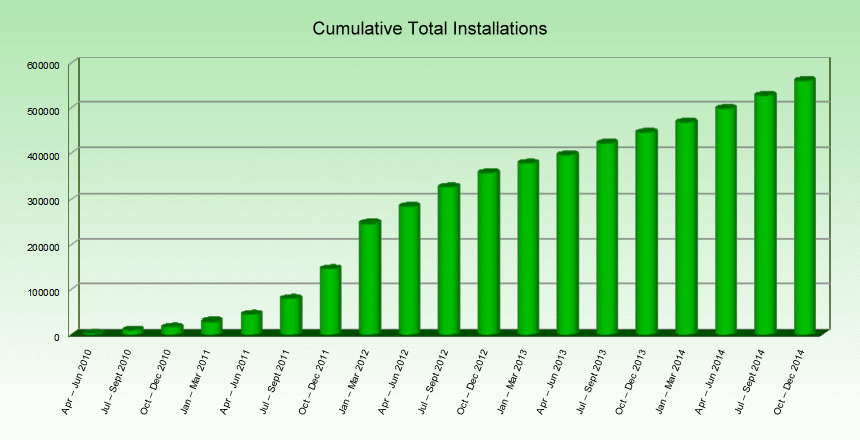
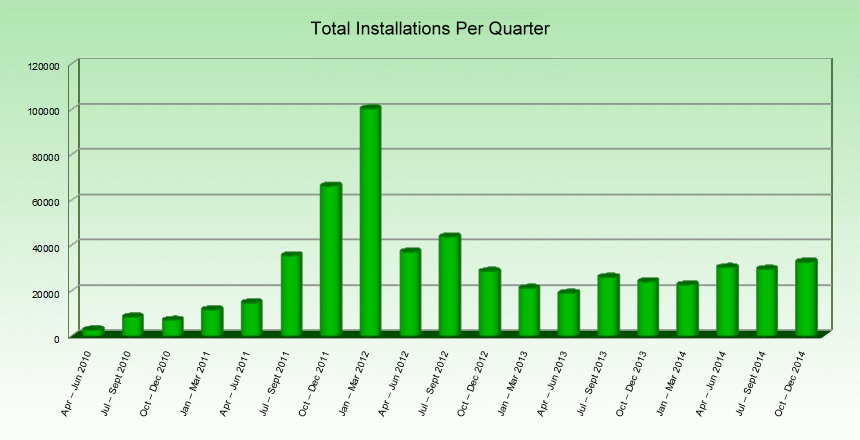
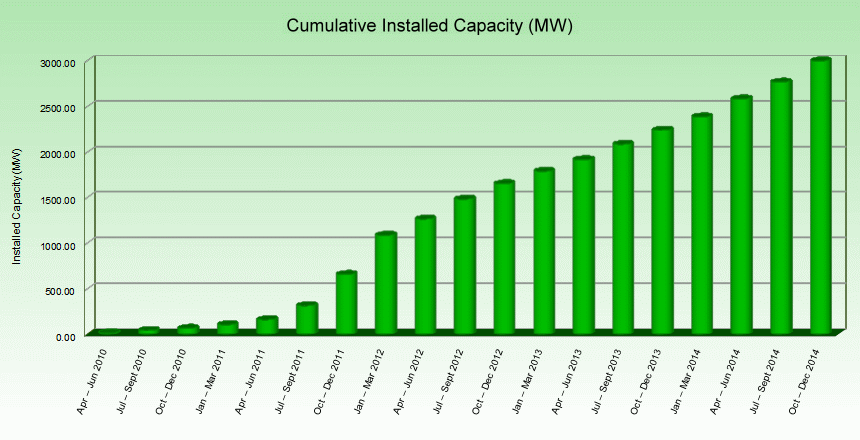
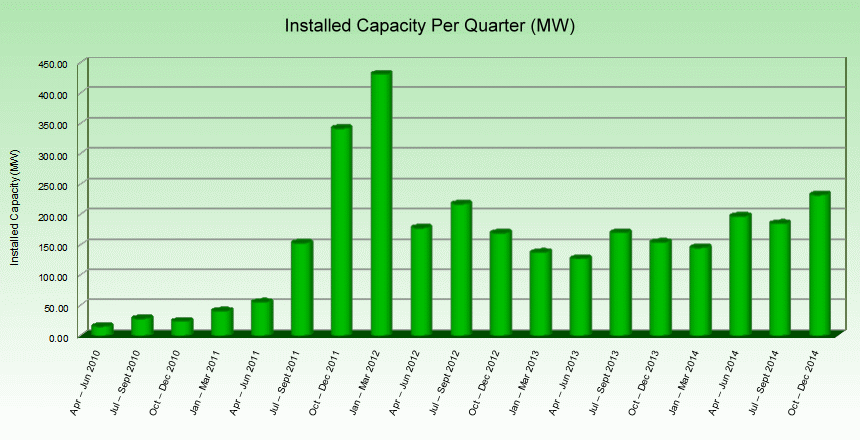
December 2014 saw installations under the UK Feed in Tariff scheme reach 560,825 and a total installed capacity of 2,988.46 MW. The fourth quarter of 2014 had 32,700 installations and 232.14 MW of added generating capacity. That’s the largest quarterly installation growth since the third quarter of 2012 and the largest capacity growth since Q1 of 2012.
Note: This report analyses Feed in Tariff data on confirmed installations up to 31st December 2014. The data analysed is based on confirmation date figures from Ofgem’s Renewables & CHP Register.
Growth in Installation Numbers Continues
In terms of installation numbers, Q4 was a strong end to a strong year. Q4 2014 saw 32,700 installations, a further increase on strong second and third quarter numbers and more than 33% up on the same quarter in 2013.
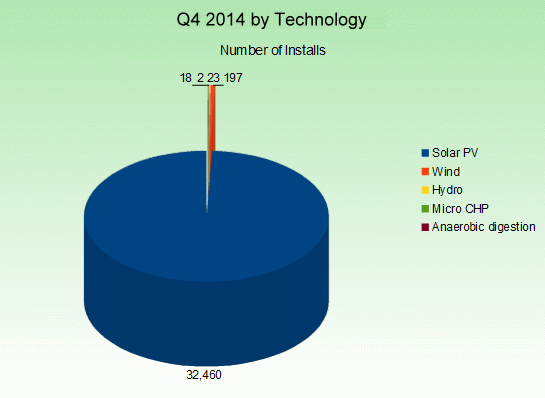
Solar PV has been, and remains the largest technology in the FiT scheme by far and 32,460 new installations was the strongest quarter of a strong year for solar PV.
Quarterly Installations by Technology
| Solar PV | Wind | Hydro | Micro CHP | Anaerobic digestion | Total | |
|---|---|---|---|---|---|---|
| Apr – Jun 2010 | 2,690 | 59 | 4 | 0 | 0 | 2,753 |
| Jul – Sept 2010 | 7,702 | 594 | 103 | 5 | 0 | 8,404 |
| Oct – Dec 2010 | 6,593 | 303 | 44 | 17 | 2 | 6,959 |
| Jan – Mar 2011 | 11,204 | 289 | 41 | 78 | 1 | 11,613 |
| Apr – Jun 2011 | 14,447 | 177 | 12 | 57 | 2 | 14,695 |
| Jul – Sept 2011 | 35,020 | 306 | 16 | 97 | 4 | 35,443 |
| Oct – Dec 2011 | 65,875 | 230 | 11 | 68 | 4 | 66,188 |
| Jan – Mar 2012 | 99,863 | 318 | 22 | 36 | 2 | 100,241 |
| Apr – Jun 2012 | 36,685 | 430 | 31 | 12 | 5 | 37,163 |
| Jul – Sept 2012 | 43,306 | 414 | 34 | 30 | 9 | 43,793 |
| Oct – Dec 2012 | 27,811 | 682 | 16 | 19 | 7 | 28,535 |
| Jan – Mar 2013 | 20,542 | 505 | 19 | 19 | 11 | 21,096 |
| Apr – June 2013 | 18,694 | 175 | 25 | 15 | 5 | 18,914 |
| July – Sept 2013 | 25,743 | 141 | 23 | 9 | 10 | 25,926 |
| Oct – Dec 2013 | 23,830 | 191 | 17 | 7 | 6 | 24,051 |
| Jan – Mar 2014 | 22,405 | 185 | 26 | 4 | 15 | 22,635 |
| Apr – Jun 2014 | 29,867 | 347 | 25 | 5 | 18 | 30,262 |
| Jul – Sept 2014 | 29,208 | 199 | 31 | 2 | 14 | 29,454 |
| Oct – Dec 2014 | 32,460 | 197 | 23 | 2 | 18 | 32,700 |
| Total | 553,945 |
5,742 |
523 |
482 |
133 |
560,825 |
Installed Capacity
Installed capacity under FiT continues to grow steadily. Q4 2014 saw 232.14 MW of installed capacity added across all technologies making it the strongest quarter since March 2012. As with installation numbers, every quarter in 2014 saw more installed capacity than the equivalent quarter in 2013.
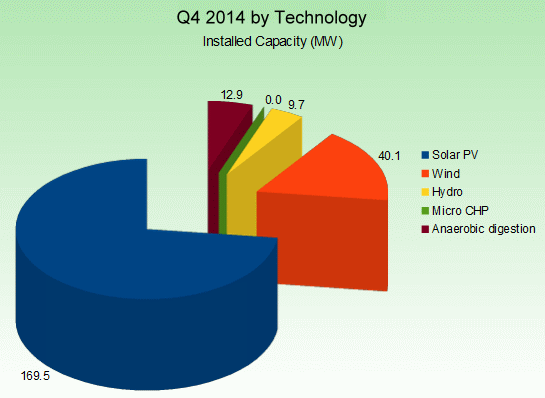
Wind, which is dwarfed by solar PV in the number of systems installed, added 40.05 MW of capacity in the quarter. Impressively, just 197 wind installations created 23.63% of the added capacity achieved by solar PV. This is wind’s strongest quarter for installed capacity since the start of the scheme.
Quarterly Installed Capacity (MW) by Technology
| Solar PV | Wind | Hydro | Micro CHP | Anaerobic digestion | Total | |
|---|---|---|---|---|---|---|
| Apr – Jun 2010 | 6.64 | 5.25 | 3.27 | 0 | 0 | 15.16 |
| Jul – Sept 2010 | 19.44 | 5.08 | 3.69 | 0.01 | 0 | 28.21 |
| Oct – Dec 2010 | 18.50 | 2.74 | 1.68 | 0.02 | 0.67 | 23.60 |
| Jan – Mar 2011 | 32.80 | 5.36 | 1.08 | 0.08 | 1.10 | 40.42 |
| Apr – Jun 2011 | 43.66 | 5.22 | 2.91 | 0.06 | 3.19 | 55.03 |
| Jul – Sept 2011 | 142.38 | 3.89 | 2.57 | 0.10 | 3.85 | 152.79 |
| Oct – Dec 2011 | 329.46 | 6.72 | 2.72 | 0.07 | 2.81 | 341.78 |
| Jan – Mar 2012 | 405.17 | 20.02 | 3.79 | 0.04 | 2.07 | 431.08 |
| Apr – Jun 2012 | 153.85 | 16.11 | 3.72 | 0.01 | 4.01 | 177.69 |
| Jul – Sept 2012 | 185.88 | 17.00 | 5.14 | 0.04 | 9.12 | 216.99 |
| Oct – Dec 2012 | 146.81 | 14.23 | 3.55 | 0.02 | 4.56 | 169.17 |
| Jan – Mar 2013 | 98.32 | 31.06 | 0.96 | 0.02 | 6.80 | 137.16 |
| Apr – June 2013 | 99.46 | 17.62 | 2.24 | 0.02 | 7.70 | 127.03 |
| July – Sept 2013 | 138.62 | 23.14 | 1.75 | 0.01 | 6.36 | 169.87 |
| Oct – Dec 2013 | 127.45 | 20.54 | 3.57 | 0.01 | 2.29 | 153.86 |
| Jan – Mar 2014 | 107.33 | 20.70 | 3.54 | 0 | 13.47 | 145.05 |
| Apr – Jun 2014 | 149.78 | 27.68 | 1.42 | 0.01 | 17.80 | 196.68 |
| Jul – Sept 2014 | 150.31 | 18.07 | 8.31 | 0 | 8.05 | 184.75 |
| Oct – Dec 2014 | 169.52 | 40.05 | 9.67 | 0 | 12.89 | 232.14 |
| Total | 2,525.21 |
300.45 |
65.57 |
0.49 |
106.74 |
2,998.46 |
Renewable Installations by Technology
Q4 2014 (Oct – Dec)
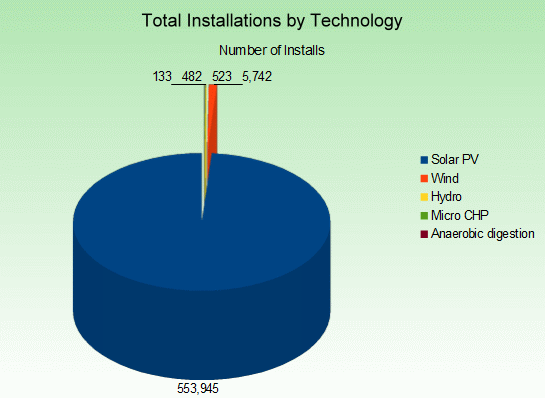
When looking at installation numbers, solar PV remains by far the dominant FiT technology, as it has been since the beginning of the scheme.
| Technology | Number of Installs |
|---|---|
| Solar PV | 32,460 |
| Wind | 197 |
| Hydro | 23 |
| Micro CHP | 2 |
| Anaerobic digestion | 18 |
All Time
| Technology | Number of Installs |
|---|---|
| Solar PV | 553,945 |
| Wind | 5,742 |
| Hydro | 523 |
| Micro CHP | 482 |
| Anaerobic digestion | 133 |
Renewable Generation Capacity by Technology
Q4 2014 (Oct – Dec)
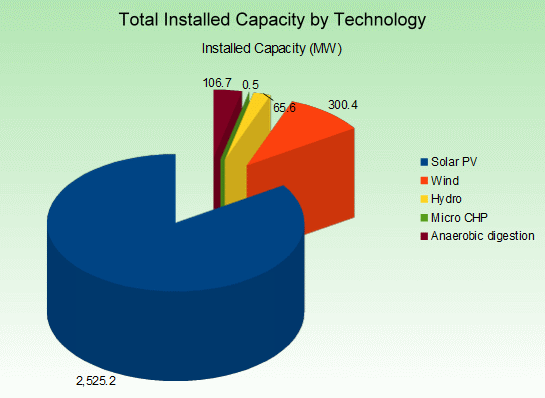
Solar PV also accounts for by far the majority of added generation capacity under FIT but other technologies are much bigger contributors in capacity terms than installation numbers. Wind, anaerobic digestion and hydro all had big quarters and added significant capacity. All three technologies have comparatively tiny installation numbers but installations generally have larger generation capacity than with solar PV.
| Technology | Installed Capacity |
|---|---|
| Solar PV | 169.52 MW |
| Wind | 40.05 MW |
| Hydro | 9.67 MW |
| Micro CHP | 0 MW |
| Anaerobic digestion | 12.89 MW |
All Time
| Technology | Installed Capacity |
|---|---|
| Solar PV | 2,525.21 MW |
| Wind | 300.45 MW |
| Hydro | 65.57 MW |
| Micro CHP | 0.49 MW |
| Anaerobic digestion | 106.74 MW |
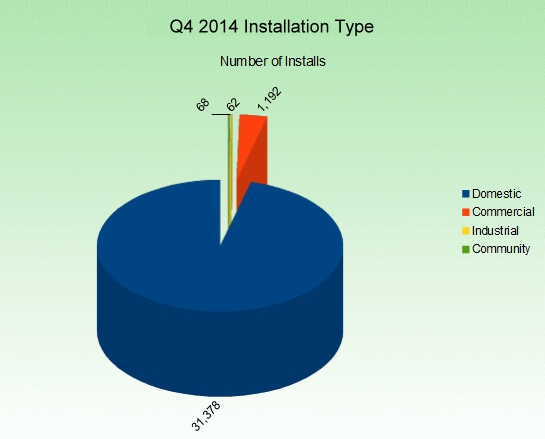
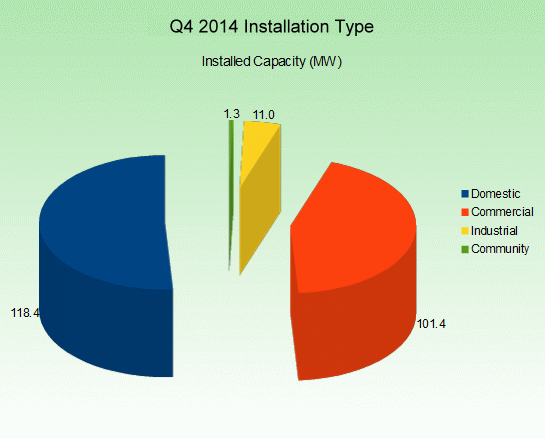
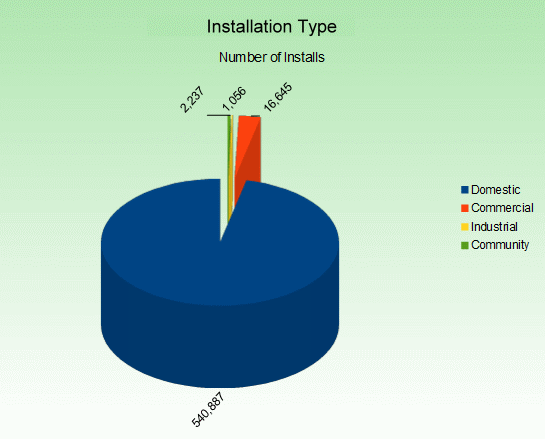
Domestic vs Non-domestic
Q4 2014 (Oct – Dec)
| Number of Installs | Installed Capacity (MW) | |
|---|---|---|
| Domestic | 31,378 | 118.44 |
| Commercial | 1,192 | 101.39 |
| Industrial | 62 | 11.00 |
| Community | 68 | 1.31 |
All Time
| Number of Installs | Installed Capacity (MW) | |
|---|---|---|
| Domestic | 540,887 | 1874.03 |
| Commercial | 16,645 | 965.56 |
| Industrial | 1,056 | 121.45 |
| Community | 2,237 | 37.41 |


