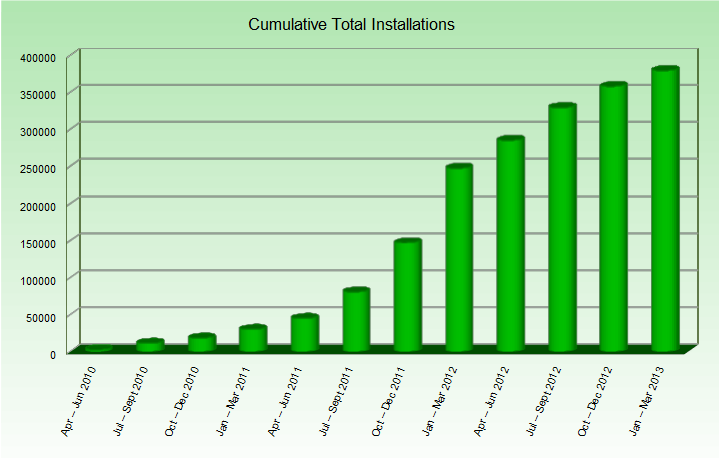
The first quarter of 2013 saw installations under the Feed in Tariff scheme reach 379,511 and 1,792.32 MW of installed renewable capacity. Between January and March 2013 there were 21,255 installations and 137.51 MW added under the scheme.
Growth in Installations Slows
Growth in installations continued to tail off in Q1 2013 in what is beginning to look like a trend. This quarter’s 21,255 installations is the lowest number of FIT installations since the second quarter of 2011.
Installations under FIT are heavily dominated by domestic solar PV and the solar tariff reduction from April 2012 clearly impacted the market. There was a rush to avail of the old higher tariff in Q4 2011 and Q1 2012. Further reductions to the solar Feed in Tariff in Autumn 2012 may well have had a similar, if more moderate impact. This impact is difficult to isolate and it may yet be that solar PV installations have a seasonal trend and will pick up as we move into sunnier weather.
Growth in Installed Capacity More Stable
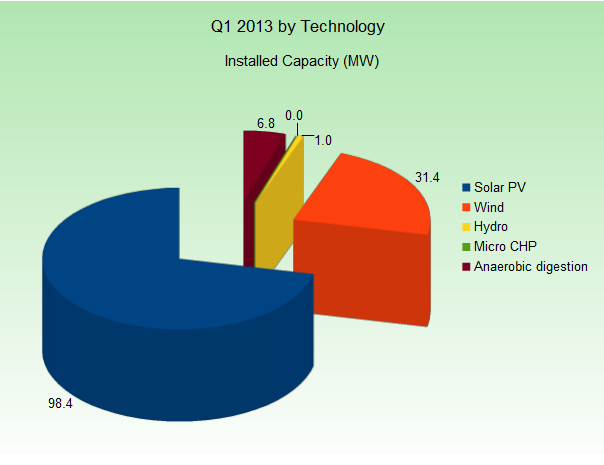
Growth in installed capacity remains more stable than that in number of installations. Wind, hydro and anaerobic digestion have more impact on installed capacity, moderating the impact of solar PV numbers. These technologies all have larger average capacities. Wind in particular had a strong quarter, adding 31.36 MW.
Renewable Installations by Technology
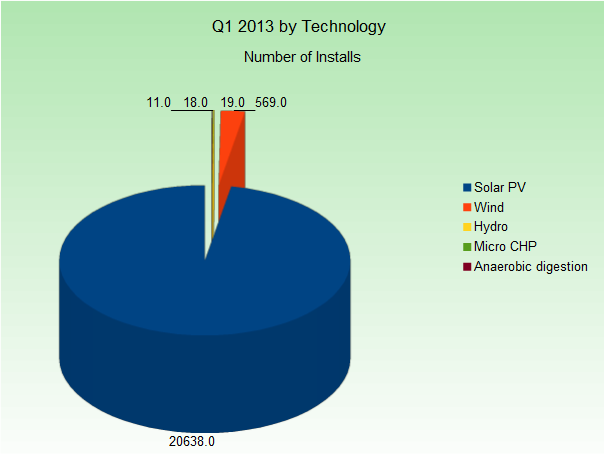
Solar PV is by far the dominant technology under the Feed in Tariff scheme accounting for some 98.55% of all installations to date. Q1 2013 however was a comparatively weak quarter for solar. The 20,638 installations still far outstrip other technologies but are at a lower point than any quarter since Q2 of 2012.
Wind had a strong first quarter and indeed has been strong for the last 5 quarters. From January to March 2013, there were 569 wind installations. Although far from the numbers achieved by solar PV, wind is comfortably the second biggest technology under FIT and seems to be performing strongly.
For full data on all technologies through previous quarters please see FIT Data Analysis April 2010 to March 2013.
| Technology | Number of Installs |
|---|---|
| Solar PV | 20,638 |
| Wind | 569 |
| Hydro | 19 |
| Micro CHP | 18 |
| Anaerobic digestion | 11 |
Renewable Generating Capacity by Technology
As well as dominating installation numbers, solar PV also dominates capacity with 88.45% of installed capacity over the 3 years of the FIT scheme. Solar PV accounted for the bulk of installed capacity from January to March 2013. Just as in number of installations however, solar’s quarterly installed capacity has reduced for the last 2 quarters running and is now at a lower point than any since Q2 2011.
Wind had a particularly strong quarter, adding 31.36 MW of installed capacity. That is more added wind capacity this quarter than in any quarter since the start of the Feed in Tariff.
For full data on all technologies through previous quarters please see FIT Data Analysis April 2010 to March 2013.
| Technology | Installed Capacity |
|---|---|
| Solar PV | 98.37 MW |
| Wind | 31.36 MW |
| Hydro | 0.96 MW |
| Micro CHP | 0.02 MW |
| Anaerobic digestion | 6.8 MW |
Domestic vs Commercial
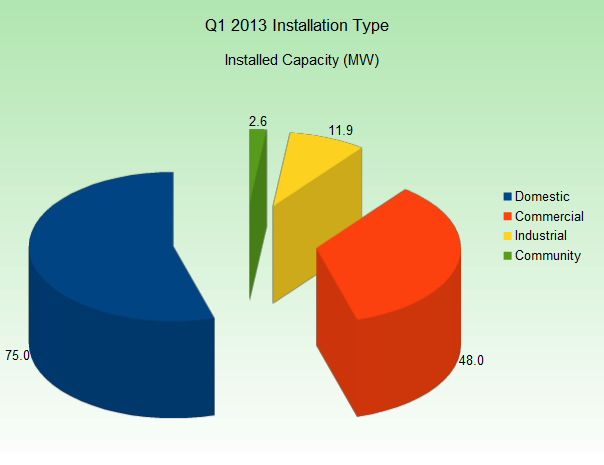
Domestic continues to account for the vast bulk of installations under the Feed in Tariff scheme. Commercial, industrial and community installations however have predictably larger generating capacities and are important contributors to generating capacity.
| Number of Installs | Installed Capacity (MW) | |
|---|---|---|
| Domestic | 20,419 | 75.05 |
| Commercial | 702 | 47.98 |
| Industrial | 61 | 11.86 |
| Community | 73 | 2.62 |
Methodology
This report analyses Feed in Tariff data on confirmed installations for the first 3 months of 2013. The data analysed is based on confirmation date data from Ofgem’s Renewables & CHP Register. For more details on Feed in Tariff data from the start of the scheme, see FIT Data Analysis April 2010 to March 2013.


