

UK Domestic Solar Panel
Costs and Returns
2019
Key Findings
In 2019, with the Feed in Tariff closing to new entrants from April 1st, Green Business Watch returns to our analysis of UK Solar Panel Costs and Returns. We outline the current situation (Q1 2019) in the context of FIT and go on to consider costs, savings and returns post Feed in Tariff.
Domestic Solar Panel Returns Up To 6.50% As Electricity Prices Rise
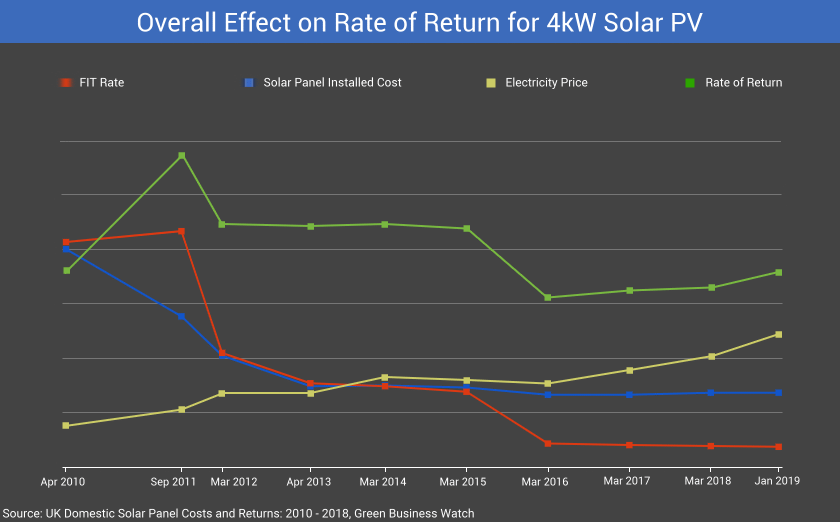
Despite a reduction in tariff rates from 41.4 p/kWh in 2010 to 3.79 p/kWh in January 2019, rising electricity prices are driving solar PV returns up over the last 2 years.
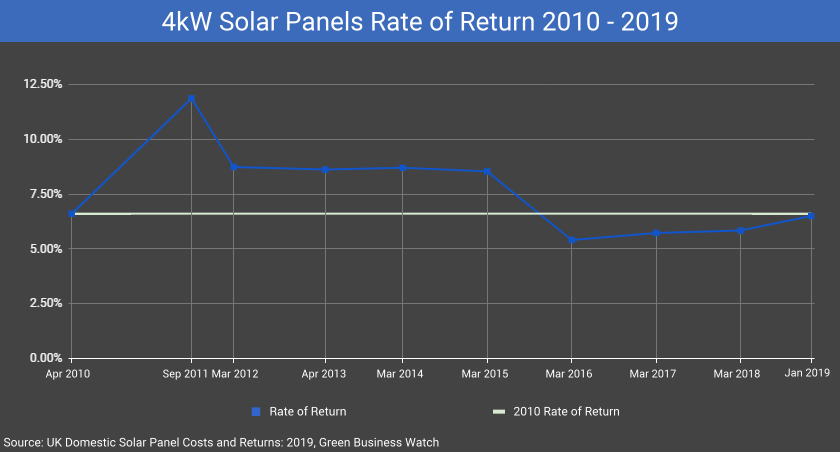
Typical returns for a well sited 4kW solar panel installation in January 2019 came in at a surprising 6.50%. While down considerably from the peak, returns are in line with those available at the start of the scheme.
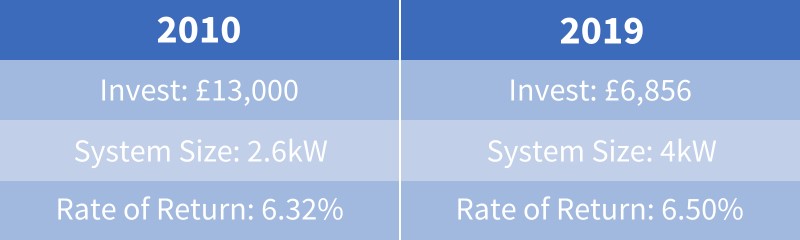
At the launch of the Feed in Tariff in 2010, a 2.6kW installation would have cost £13,000 and the estimated rate of return was 6.32%.
As the solar market has developed and costs have come down, the typical size of installations has risen. A typical 4kW installation in 2018 / 2019 comes in with a median cost of £6,856 and at time of publication delivers an estimated rate of return at 6.50%.
Solar Panel Returns Post Feed in Tariff
The Government has announced that the Feed in Tariff will close to new entrants from April 1st of this year. The removal of the incentive scheme that has underpinned the growth of solar PV since 2010 will have a significant negative impact on returns. But what does the landscape look like post Feed in Tariff?
The answer depends largely on the level of payment for exported electricity. That is, electricity that is unused on site and is “exported” back to the grid. Current export tariff arrangements will not be available to new installs after the closure of the Feed in Tariff. The government has announced what it calls the Smart Export Guarantee. This basically guarantees that homeowners will be paid by the energy companies for electricity exported to the grid but does not set a rate.
The table below compares the return and payback times for 3 cases. A system installed in 2019 and receiving FIT payments, a system installed with no FIT payments but getting export payments in line with the current scheme (5.24 p/kWh), and a system with no FIT and no export payment.
| 2019 FIT | Post FIT with Export | Post FIT no Export | |
|---|---|---|---|
| Capacity | 4kW | 4kW | 4kW |
| System Payback Time | Year 13 | Year 17 | Year 21 |
| Rate of Return | 6.50% | 4.85% | 2.84% |
Over the last decade solar has taken great strides towards subsidy free viability. It is clear from the figures above however, that the next period will be challenging. Over their 30 year lifetime, electricity savings are likely to be considerable and panels will more than pay for themselves, especially with a reasonable export payment. The return however is due to electricity price inflation and is coming in the second half of the lifetime of the panels. A 17 year payback time is asking for some very long term thinking on the part of buyers.
The hope for solar post Feed in Tariff must lie in prices coming down and the advancement of battery storage. See Section 7 and Section 9 for further discussion of the situation Post Feed in Tariff.
Installation Costs Have Stopped Falling
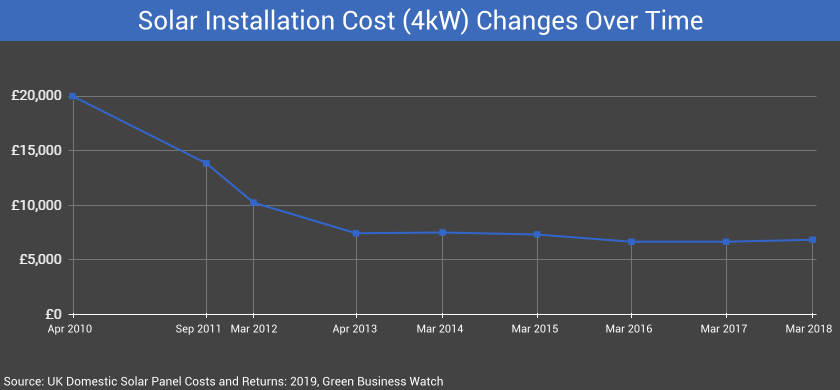
The median cost of a 4kW installation has reduced from £20,000 in 2010 to £6,856. This represents a 66% drop in median installation cost since 2010.
Over the early years of the Feed in Tariff, reductions in the installed cost of solar panels were a main driver in achieving positive rates of return for householders. Despite many tariff reductions over the years, the estimated returns have kept pace with where they were at the launch of the scheme.
As can be seen from the graph above, however, the cost reductions have slowed considerably over time. From 2010 to 2012, installation costs dropped from £20,000 to £10,252, a reduction of 49%. By 2014 they had fallen a further £2,732 to £7,520. From 2014 to 2016 costs fell again but by only £852 and since 2016 costs have stayed pretty much static.
Deals on Price are Available and Will Impact Returns
For the first time in this year’s Solar Panel Costs and Returns, we conducted primary research with installers to back up MCS data on costs. Our survey indicates that although the latest median installation costs according to the MCS remain as high as £6,856, there are much cheaper deals available in the current market. Our survey of installer prices gave us a median quoted price of £5,657 for a 4kW system.
Prices quoted in the survey ranged from a low of £4,200 to a high of £7,500. Perhaps more meaningful than average prices, we found that the quotes tended to fall into 2 brackets. Eight of the quotes fell into what we might loosely define as a lower price range of between £4,500 to £5,500. Seven of the quotes fell between £6,000 and £7,500.
The importance here is that a good deal on price increases your returns and lowers payback time for a system. An installation at the current median cost of £6,856 that receives FIT payments is looking at paying for itself in its 13th year. With panels having an expected lifetime as high as 35 years that still leaves plenty of years of profitable generation. With an installation cost of £5,000, however, that system can pay for itself as early as year 10.
Post Feed in Tariff, a system installed for £6,856 will take until year 17 to pay off. At an installation cost of £5,000, payback time is reduced to a much more reasonable 13 years. For more on these comparisons see Section 9: The Impact of Getting a Good Deal.
In all of this, it is important to remember that different prices quoted are for different systems. Typically this is exhibited in the brand and type of panel and inverter used. Buyers need to assess the pros and cons of these choices in consultation with their installers.
Larger Installs Offer Householders the Potential for Greater Returns
Until February 2016, the smallest band of the Feed in Tariff topped out at 4kW and provided the highest tariff level. This effectively set a maximum size for domestic installations. Since 2016 however, tariff structures have changed. The two lowest bands were combined and the tariff rate is now the same from 0 to 10kW. This opens the prospect of installing systems larger than 4kW. Doing so, where space and usage levels make sense, offers the potential of even higher savings and rates of return.
Contents
- Key Findings
- Domestic Solar Panel Returns up to 6.50% Despite Tariff Reductions
- Solar Panel Returns Post Feed in Tariff
- Installation Costs Have Stopped Falling
- Deals on Price are Available and Will Impact Returns
- Larger Installs Now Offer Householders the Potential for Greater Returns
- Section 1: Introduction
- Section 2: Methodology
- Section 3: Solar Panel Feed in Tariff Rate Reductions 2010 – 2019
- Section 4: Solar Panel Installation Cost Reductions 2010 – 2019
- Section 5: Domestic Electricity Cost Increases 2010 – 2019
- Section 6: Solar Panel Rate of Return and System Payback Times 2010 – 2019
- Cost and Returns Comparison 4kW Solar PV
- Comparing Returns on £7,500: 2010 vs 2014 vs 2019
- Section 7: Solar PV Returns Post Feed in Tariff
- Section 8: Primary Survey on Costs
- Section 9: The Impact of Getting a Good Deal
- Appendix A: Data Sources
- Appendix B: Installation Cost Data
- Appendix C: Electricity Price Data and Assumptions
- Appendix D: Calculating Rate of Return
Introduction
This report compares UK domestic solar panel costs and returns over the period from the launch of the Feed in Tariff in 2010, through to January 2019.
Returns from solar are a balance of the cost of solar panel installations, the Feed in Tariff rate available and electricity savings. On two occasions since the start of the scheme the Government has intervened to dramatically reduce tariffs. These large scale reductions happened in March 2012 and again in the first quarter of 2016. In both cases the cuts caused considerable shock to the market.
The tariff rate for solar panels has fallen from 41.3p/kWh at the launch of the scheme in 2010 to 3.79p/kWh today (January 2019). This report considers costs, tariff rates and potential savings in order to outline current expected rates of return for domestic solar panel installations and to compare them with costs and returns available since 2010. It also considers the impact on savings and returns of the upcoming closure of the Feed in Tariff to new entrants.
Methodology
We have sourced cost data for solar panel installations (up to 4kW) providing snapshots in time of typical, mid-range, solar PV installation costs. This data is taken from one-off studies conducted by Parsons Brinkerhoff and Cambridge Economic Policy Associates for DECC as part of various reviews, consultations and modelling exercises relating to the solar PV Feed in Tariff. Since April 2013 solar cost data has been gathered through the Microgeneration Certificate Scheme (MCS) database and BEIC have published cost data for systems from April 2013 to March 2018. We have compared costs and returns at 9 points in time since April 2010. Details of sources, assumptions and methods used are included in the appendices.
For the first time in this year’s report we have also conducted primary pricing research and have gathered quotes directly from installers. We present this information in parallel with the MCS figures to give some insight into the range of products and pricing that is available in the current market.

Solar Panel Feed in Tariff Rate Reductions 2010 – 2019
The Feed in Tariff was launched in April 2010 and was initially set at a rate of 41.3p/kWh. The early years of the scheme saw uptake of solar PV run far ahead of expectations which went hand in hand with large reductions in the cost of installation. As a result, in March 2012 the tariff rate for solar PV was reduced to 21p/kWh and in August 2012 it reduced further to 16p/kWh. August 2012 also saw the introduction of a responsive approach to tariff reduction called degression. Solar PV tariff rates reduced each quarter, provided that deployment targets were met. If deployment levels in any given band were low, then the degression cuts were skipped but not for more than 2 quarters in a row.
This degression system stayed in place until the first quarter of 2016 when major changes were made to the solar Feed in Tariff. At that time, the tariff rate reduced from 12.47 p/kWh to 4.39 p/kWh and a new degression system came into place. At publication of this report in January 2019, the FIT rate for solar PV up to and including 4kW is 3.79p/kWh.
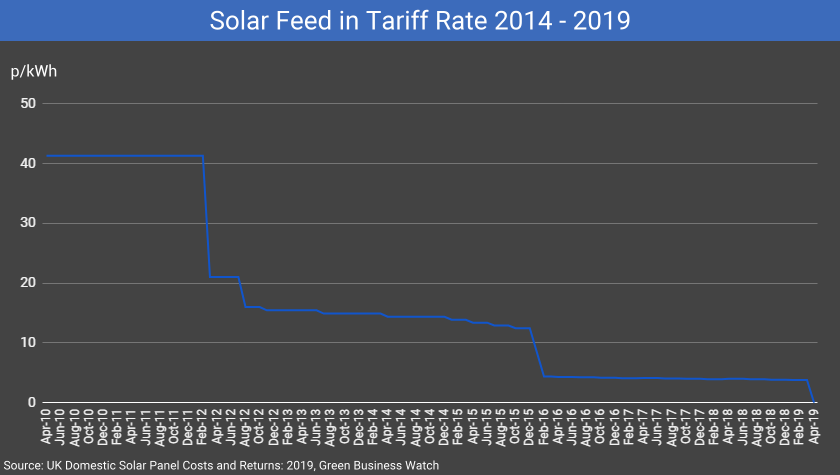
Cuts to the FIT rate in 2012 caused quite a shock to the market and left a lingering question in the minds of some consumers. The rate reduction in early 2016 repeated the same process with a clear chilling effect on the market. The effects can be seen in dramatically reduced installation numbers and with solar panel installers leaving the market in droves. For the consumer, one telling impact is that installation prices have stopped coming down.
The solar Feed in Tariff is now a fraction of its original 41.3p/kWh but reductions in the cost of installing solar PV and electricity price increases have continued at a pace that offsets cuts in government support. With the Feed in Tariff due to close from April 1st 2019, however, that will soon change.
Solar Panel Installation Cost Reductions Since 2010
In 2010, when the Feed in Tariff scheme was launched, a 4kW solar PV installation cost approximately £20,000. The most recent cost estimates from BEIS put the median cost for the same installation in March 2018 at £6,856. This represents a 66% drop in the median installation cost for a 4kW system since 2010.
As can be seen from the graph above, however, these cost reductions have slowed considerably over time. From 2010 to 2012, installation costs dropped from £20,000 to £10,252, a reduction of 49%. By 2014 they had fallen a further £2,732 to £7,520. From 2014 to 2016 costs fell again but by only £852 and since then, costs have stayed pretty much static.
This is a worrying development. Continued reductions in installation costs are important if domestic solar is going to survive the impending end of the Feed in Tariff. With the Feed in Tariff set to close from April 1st, a healthy market will depend on continuing to provide a return on investment for homeowners. This return will come predominantly in the form of electricity savings but both return on investment and payback times for solar are heavily influenced by the initial cost of the system.
Domestic Electricity Cost Increases Since 2010
Domestic electricity bills are on the increase. This is important because income from solar panel installations comes from a combination of three sources:
- Savings on electricity costs
- FIT generation income
- Export income
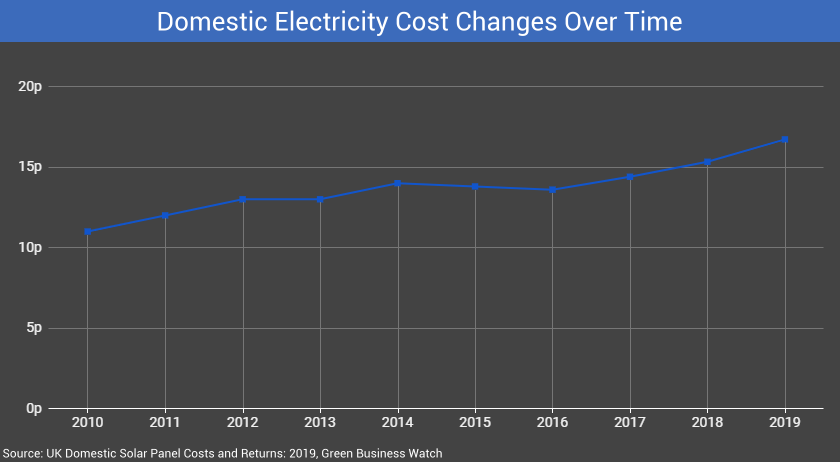
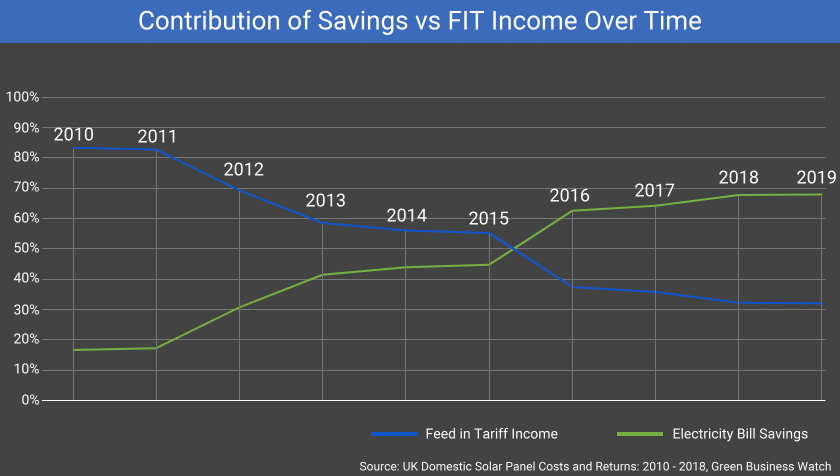
Solar panel returns are a balance of income from the Feed in Tariff and savings on electricity bills. As Feed in Tariff levels have reduced and electricity bills have risen over the years, this balance has shifted. Since the tariff cuts in February 2016, savings are now a larger part of the return from solar PV than tariff income. With the Feed in Tariff set to be abolished at the end of March, electricity cost savings will constitute the vast bulk of any returns attainable.
Retail electricity costs seem to have resumed their long term rising trend. While this is not good news for consumers, it has a positive impact on the economics of solar panels.
For the householder considering solar panels, their actual usage profile will have a huge impact on their expected returns. It is very important to get a clear picture of your household’s electricity use and how it will affect your returns. This is a standard part of the assessment installers will undertake for you before you decide to buy.
The increasing importance of electricity savings also means that maximising savings by using as much free solar electricity as you can is likely to have a big impact on your return on investment. This has implications for battery storage and other add-on technologies that aim to maximise the productive use of your free solar electricity on-site, thereby increasing your returns.
Solar Panel Rate of Return and System Payback Times Since 2010
With all these changes since the introduction of FIT, what is the overall impact? Or, to put it another way, with all the cuts to the FIT rates, is solar PV still a worthwhile investment in 2019?
Cost and Returns Comparison 4kW Solar PV
One of the consequences of the decreasing cost of solar is the ability of householders to invest in larger systems for the same or less money. As a result, larger systems have become more and more common. Here we compare costs and returns for a 4kW system. 4kW would have been a huge investment in 2010 but has become increasingly typical over the course of the scheme.
| 2010 (Apr) |
2011 (Sep) |
2012 (Mar) |
2013 (Apr) |
2014 (Mar) |
2015 (Mar) |
2016 (Mar) |
2017 (Mar) |
2018 (Mar) |
2019 (Jan) |
|
|---|---|---|---|---|---|---|---|---|---|---|
| Cost of System | £20,000 | £13,846 | £10,252 | £7,440 | £7,520 | £7,336 | £6,668 | £6,668 | £6,856 | £6,856 |
| Annual Operating Costs | £70 | £70 | £70 | £70 | £70 | £70 | £70 | £70 | £70 | £70 |
| FIT Tariff Rate | 41.3 p/kWh | 43.3 p/kWh | 21 p/kWh | 15.44 p/kWh | 14.90 p/kWh | 13.88 p/kWh | 4.39 p/kWh | 4.11 p/kWh | 3.93 p/kWh | 3.79 p/kWh |
| Export Tariff | 3 p/kWh | 3.1 p/kWh | 3.2 p/kWh | 4.64 p/kWh | 4.64 p/kWh | 4.77 p/kWh | 4.85 p/kWh | 5.03 p/kWh | 5.03 p/kWh | 5.24 p/kWh |
| Electricity Price | 11 p/kWh | 12 p/kWh | 13 p/kWh | 13 p/kWh | 14 p/kWh | 13.8 p/kWh | 13.6 p/kWh | 14.4 p/kWh | 15.33 p/kWh | 16.72 p/kWh |
| FIT Income (30 years) | £50,069 | £52,493 | £25,459 | £13,864 | £13,380 | £12,464 | £3,942 | £3,691 | £3,529 | £3,403 |
| Export Income (30 years) | £2,361 | £2,439 | £2,518 | £3,651 | £3,651 | £3,753 | £3,816 | £3,958 | £3,958 | £4,123 |
| Electricity Savings (30 years) | €10,488 | £11,441 | £12,395 | £12,395 | £13,348 | £13,158 | £12,967 | £13,730 | £14,616 | £15,942 |
| Total Income & Saving | £62,917 | £66,374 | £40,371 | £29,910 | £30,379 | £29,375 | £20,725 | £21,378 | £22,103 | £23,468 |
| System Payback Time | Year 11 | Year 8 | Year 10 | Year 9 | Year 9 | Year 9 | Year 14 | Year 14 | Year 14 | Year 13 |
| Rate of Return | 6.61% | 11.87% | 8.74% | 8.62% | 8.70% | 8.54% | 5.41% | 5.73% | 5.84% | 6.50% |
Since the Government’s changes to the scheme in 2016, the solar tariff rates are the same from 0 to 10kW which opens up the prospect of installing more than 4kW where the space and the usage are there to justify it.
Comparing Returns on £7,500: 2010 vs 2014 vs 2019
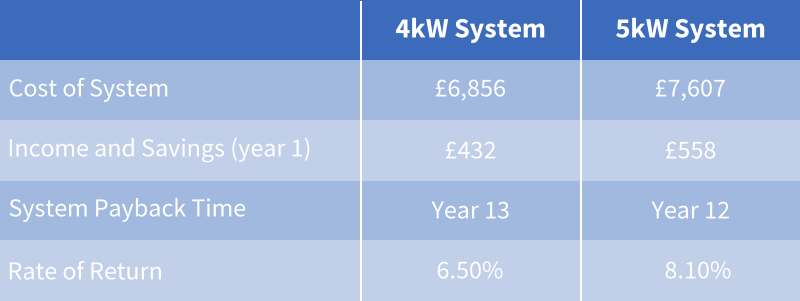
Reducing installation costs have not only positively impacted on the rate of return. Another consequence of falling installation costs is its effect on what you can get for your money. If you had £7,500 to invest in 2010 you would only have been able to afford a £1.5kW system. In 2014, £7,500 would have bought you a 4kW install and in 2019 it could potentially pay for 5kW.
| 2010 | 2014 | 2019 | |
|---|---|---|---|
| Cost of System | £7,500 | £7,520 | £7,607 |
| Capacity | 1.5kW | 4kW | 5kW |
| FIT Rate | 41.3p/kWh | 14.9p/kWh | 3.79p/kWh |
| FIT Income (30 years) | £18,776 | £13,380 | £4,254 |
| Export Income (30 years) | €885 | £3,651 | €5,154 |
| Electricity Bill Savings (30 years) | €3,933 | £13,348 | €19,927 |
| System Payback Time | Year 12 | Year 9 | Year 12 |
| Rate of Return | 5.71% | 8.70% | 8.10% |
Solar PV Returns Post Feed in Tariff
The Government has announced that the Feed in Tariff will close to new entrants from April 1st of this year. The removal of the incentive scheme that has underpinned the growth of solar PV since 2010 will have a significant negative impact on returns. But what does the landscape look like post Feed in Tariff?
At the current FIT rate of 3.79 p/kWh, we estimate that generation payments from FIT will come to £3,403 over the 20 year term of the scheme. Export payments, account for a further £4,123 out of a total lifetime income and savings that is estimated to be £23,468. Whatever way we look at it, that is going to be a substantive hit to the savings and returns that can be expected from Solar PV. How much of a hit will depend on the introduction of a fair payment for electricity exported to the grid.
In January 2019, the Government announced proposals for a Smart Export Guarantee. The Smart Export Guarantee proposal involves legislating that all large energy suppliers will have to remunerate small-scale generators for the electricity they export to the grid. Electricity companies will offer the generator a price per kilowatt hour for exported electricity with the level of payment and length of contract being left to each electricity company to determine. The Government’s approach to the export pricing is “smarter the better”, with BEIS envisaging simplistic options like flat rate tariffs giving way (perhaps over time) to flexible prices, for example prices that rise and fall based on half-hourly wholesale electricity market prices.
In the table below, we compare the savings and returns from a 4kW install that receives FIT at the current rate with two possible future scenarios. The first is no Feed in Tariff payment but an export payment at the same level as the current FIT export tariff. The current export tariff is 5.24 p/kWh. There is no way of telling in advance what export prices will be available under the Smart Export Guarantee and they will vary from supplier to supplier. A rate of 5.24 p/kWh doesn’t seem unreasonable based on current wholesale market prices and the calculation below assumes that the rate paid will increase in line with the RPI.
The third option presented below is that of no Feed in Tariff and no Export payment at all. This is very much a worst case scenario and indeed this will be the case that pertains when the FIT scheme closes from April 1st, until the Smart Export Guarantee comes into place.
| 2019 FIT | 2019 Post FIT | 2019 Post FIT no Export | |
|---|---|---|---|
| Cost of System | £6,856 | £6,856 | £6,856 |
| Capacity | 4kW | 4kW | 4kW |
| FIT Rate | 3.79 p/kWh | 0 p/kWh | 0 p/kWh |
| FIT Income | £3,240.06 | £0 | £0 |
| Export Income (30 years) | £4123.21 | £4123.21 | 0 |
| Electricity Bill Savings (30 years) | £15,941.58 | £15,941.58 | £15,941.58 |
| System Payback Time | Year 13 | Year 17 | Year 21 |
| Rate of Return | 6.50% | 4.85% | 2.84% |
As with all of the calculations in this report, we have calculated the lifetime savings and the annualised rate of return over a 30 year lifetime. You can see from the table above that even without an export payment a 4kW solar panel installation is still estimated to achieve a return over 30 years. Albeit a return that is hardly appealing over such a long term.
Perhaps the best place to see the impact of the end of FIT support is in the payback term. We calculate that a system installed today and receiving FIT will pay for itself sometime during year 13. Removing the generation tariff from FIT but assuming an export tariff in-line with the current situation, lengthens the payback time to year 17. With no export payments at all, it would take until year 21 for electricity savings to pay for the solar panels at current installed costs.
Primary Survey on Costs
We sought sample quotes from some 50 installers and received responses from 17. The short survey was conducted by email and telephone.
Installers were asked to provide an indicative price (complete installed cost, inclusive of VAT, scaffolding and any other costs) for a typical solar PV installation of 4kW in size.
They were asked to provide information on the panels and inverter used in the system their price was based on and any other information they thought relevant.
The survey went on to ask installers for the price per additional kW.
Indicative prices for a 4kW Solar Panel System
The indicative prices given by installers ranged from a low of £4,200 to a high of £7,500. The median price quoted was £5,657.50 and the mean price quoted was £5,639.56. Only 2 of the quoted prices were under £4,500 and only 2 were over £7,000.
The prices quoted in the survey response are spread throughout the range from low to high. Eight of the quotes fell into what we might loosely define as a lower price range of between £4,500 to £5,500. Seven of the quotes fell between £6,000 and £7,500.
The difference in those prices largely comes down to the choice of solar panel brand and inverter. This is an area where different installers will make the case for different setups.
Panel Choice and the Makeup of Systems
Well known branded panels not unexpectedly appear to come at a price premium. Higher quotes more often included micro inverters and SolarEdge in particular. The mid-range and lower priced quotes tended to feature Chinese and Korean panel manufacturers. It should be noted that as with many other products today, there are a number of panel manufacturers from these countries that are establishing well known brands.
Price per extra kW above 4kW
Adding an extra kW and gettin 5kW instead of 4kW is an option that can work out well, assuming you have the space to do it and the electricity usage that would allow for the savings to be worth it. That extra kW is likely to prove significantly cheaper than the per kW cost of a 4kW system. Fixed costs such as scaffolding, marketing costs, overheads and much of the staff cost of the installation are already factored into the price of your first 4kW. So the extra kW is likely to be good value.
We asked installers to indicate a price for the addition of an extra kW capacity above 4kW. Twelve installers responded to the question with prices that ranged from £500 to £1,000 per kW. The price for extra kW is going to depend on panel price and inverter choice, as above. It will also vary by roof type and whether the additional capacity requires a change in configuration of the system (a different inverter or extra inverter etc.).
The Impact of Getting a Good Deal
If the cost of the solar PV system comes down however, it has a significant impact on the rate of return and on system payback time. A system that costs £5,000 will pay for itself quicker and start providing a return sooner than if the same system cost £7,000. Just how much of a difference does it make though?
With the Feed in Tariff
| Cost of System | £6,856 | £5,000 |
|---|---|---|
| Capacity | 4kW | 4kW |
| FIT Rate | 3.79 p/kWh | 3.79 p/kWh |
| FIT Income | £3,240.06 | £3,240.06 |
| Export Income (30 years) | £4,123.21 | £4,123.21 |
| Electricity Bill Savings (30 years) | £15,941.58 | £15,941.58 |
| System Payback Time | Year 13 | Year 10 |
| Rate of Return | 6.50% | 9.60% |
Post Feed in Tariff
The Feed in Tariff will close to new entrants on April 1st 2019. Post Feed in Tariff, as outlined above, we estimate that payback times for a 4kW solar PV install will extend from just under 13 years to just under 17 years. Investing in a system that wont pay for itself until year 17 is a bit of an ask.
As the economics of investing in domestic solar get so marginal post FIT we have to ask, what happens if you don’t pay the median price. What if you get a better deal?
| Cost of System | £6,856 | £5,000 |
|---|---|---|
| Capacity | 4kW | 4kW |
| FIT Rate | 0 p/kWh | 0 p/kWh |
| FIT Income | £0 | £0 |
| Export Income (30 years) | £4,123.21 | £4,123.21 |
| Electricity Bill Savings (30 years) | £15,941.58 | £15,941.58 |
| System Payback Time | Year 17 | Year 13 |
| Rate of Return | 4.85% | 7.88% |
* – The above assumes an export payment at 5.24 p/kWh rising in line with the RPI
Appendix A: Data Sources
Data used in the compilation of this report was gathered from the following sources:
- “Quarterly Energy Prices, June 2017” – BEIS
- “Quarterly Energy Prices, September 2014” – DECC
- “Quarterly Energy Prices, December 2013” – DECC
- “Quarterly Energy Prices, December 2012” – DECC
- “Quarterly Energy Prices, December 2011” – DECC
- “Quarterly Energy Prices, December 2010” – DECC
- Feed in Tariff Tables – Ofgem
- “Feed-in tariffs scheme: consultation on Comprehensive Review Phase 1 – tariffs for solar PV” – DECC
- “Solar PV cost update”- Parsons Brinkerhoff, May 2012
- “Solar PV Cost Data” – DECC, April 2014
- “Updates To The Feed-in Tariffs Model Documentation Of Changes For Solar Pv Consultation” – Cambridge Economic Policy Associates Ltd
and Parsons Brinckerhoff, 26 October 2011 - “Small scale solar PV cost data” – DECC, December 2013
- “Review Of Ro Banding For Small-scale Renewables A Report For The Department Of Enterprise Trade And Investment” – Cambridge Economic Policy Associates and Parsons Brinckerhoff, JANUARY 2014
Appendix B: Installation Cost Data
A consistent source of installation cost data was not available covering the whole period from the launch of the Feed in Tariff. Cost data is available from BEIS for a period beginning in April 2013 and running up to March 2018. This data is sourced from the Microgeneration Certificate Scheme (MCS) database. Cost data prior to April 2013 was gleaned, where available, from various studies and modelling exercises undertaken on behalf of DECC by Parsons Brinkerhoff.
As a result of the limited availability of cost data through the early period of the scheme we can only compare costs and returns at irregular snapshot intervals.
The figures in this report represent the median installation cost from the relevant study. In all cases they include VAT and represent an estimated installed cost. Although both BEIS’s “Solar PV Cost Data” and the previous studies are gathered from installers they are from different studies and may not be strictly comparable. It is important to note that a wide range of costs were encountered in the 0kW – 4kW data and that quotes for specific installations will vary widely from those presented here.
In preparing this years report, we also conducted primary pricing research with installers. The figures published by BEIS are presented as a per kW cost and when multiplied up for 4kW produce a median cost that seems high in the current market. Primary pricing research was conducted to assess the range of real world quotes for a 4kW system. In part, to determine how reasonable it is for consumers to achieve a better deal on price than the quoted median.
Appendix C: Electricity Price Data and Assumptions
Electricity price data was gathered from the “Quarterly Energy Prices” publications published by the Department for Business, Energy & Industrial Strategy (formerly DECC). Figures used for the electricity cost per unit in this report are based on the average annual electricity bill for the year in question. Assumed usage was 3,800 kWh per year.
- Consumer Price Index datasets – ONS
- “Quarterly Energy Prices, June 2017” – BEIS
- “Quarterly Energy Prices, September 2014” – DECC
- “Quarterly Energy Prices, December 2013” – DECC
- “Quarterly Energy Prices, December 2012” – DECC
- “Quarterly Energy Prices, December 2011” – DECC
- “Quarterly Energy Prices, December 2010” – DECC
Appendix D: Calculating Rate of Return
There are a number of assumptions involved in calculating the Rate of Return. Details on cost and electricity price data are included in the preceding appendices. Other assumptions used in the calculation for this report are included below:
| Metric | Assumption |
|---|---|
| Annual Operating Cost | £70 |
| Load Factor | 850 kWh/kW/year |
| Technology Lifetime | 35 years |
| Assumed Use | 50% on-site, 50% export |
| RPI | 2.83% |
| Electricity Price Inflation | 4% |
Just about every assumption made in the calculation has an effect on the earnings or savings and therefore the rate of return. Usage and load factor assumptions were chosen based on the DECC publication “Explanation of rate of return calculation for domestic PV” which is available as part of Feed in Tariff Comprehensive Review Phase I.
In previous editions of the report, we calculated returns using the same methodology as the explanation of rate of return document referenced above. Both the costs and the post FIT income and savings for the years between the end of FIT and the expected lifetime of the system were “squeezed” into the timeframe of the FIT term and annualised to calculate rate of return. This made sense when the scheme was launched since the savings expected post scheme were small in comparison to the income generated during the term.
Over recent years, however, savings have come to be an increasingly significant portion of the returns from solar PV. The term of the scheme has been reduced to 20 years and panels have an expected lifetime of as much as 35 years. As a result, we have altered our methodology for this year’s report. At the time of the launch of the scheme squeezing post FIT savings into the term of the scheme provided added a small amount of return that accounted for the residual value of the system when the scheme was over. In today’s calculation compressing 35 years of savings into a 20 year term artificially inflates the rate of return.
The rate of return we use here is annualised over a 30 year term. Electricity price inflation is included in the calculations and estimated at 4% per annum. The returns are post tax.