
UK Domestic Renewable Heat Update – January 2015
The latest data available for the Domestic Renewable Heat Incentive covers the period from the launch of the scheme on April 9th 2014 to the end of December 2014. The Domestic Renewable Heat Incentive (Domestic RHI) is a UK Government scheme to encourage the use of renewable heating technologies. Under the scheme, householders receive quarterly payments for a period of 7 years based on the amount of renewable heat their system produces. Figures from the scheme show renewable heat installations in the UK continuing to grow.
Key Points From December 2014
Legacy Applications Continue to Dominate
The Domestic RHI has had 22,755 applications. Legacy applications account for 70.85% (16,122) of applications to date. Only 29.15% (6,633) of applications are for “new” installations, ie those that took place since the launch of the scheme. It is new applications that give us an indication of current activity in the renewable heat market.
New Installations Continue to Grow Month on Month
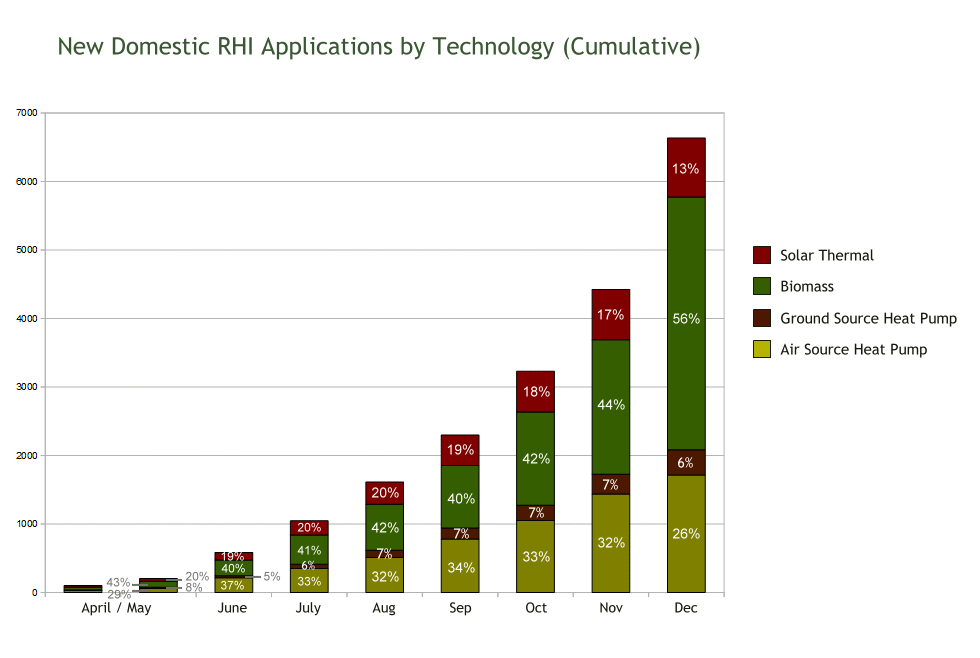
The number of installations applied for under the scheme have been increasing month on month for the 8th month running.

December Installations Up 84.94% on November
There were 2,210 new installations in December, the biggest month to date and 84.94% up on November which was previously the busiest month. Much of this growth consists of a huge increase in biomass applications in December.
Biomass Adds 1,730 Installs in a Record Month
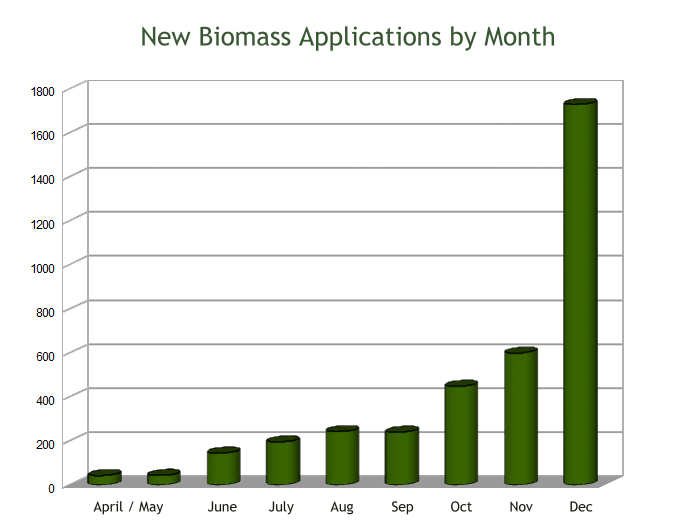 Biomass has been the most popular technology since the launch of the domestic RHI and it’s upward surge accelerated even further in December. Biomass now accounts for 56% of new installations under the Domestic RHI.
October was a particularly strong month for biomass with 449 new installations and November went even higher with 600 new applications. December has eclipsed them both with 1,730 new applications for Biomass.
That is more Biomass installations in December than there were for the other 3 technologies combined. It is almost 3 times the previous record month for new biomass applications. In fact, December’s installations account for 46.88% of the total new applications for biomass since the scheme came into effect in April 2014. December’s accelerated growth for biomass could well be caused by a rush to get applications submitted before the tariff drop for biomass on January 1 2015.
Ground Source Continues to Build Slowly
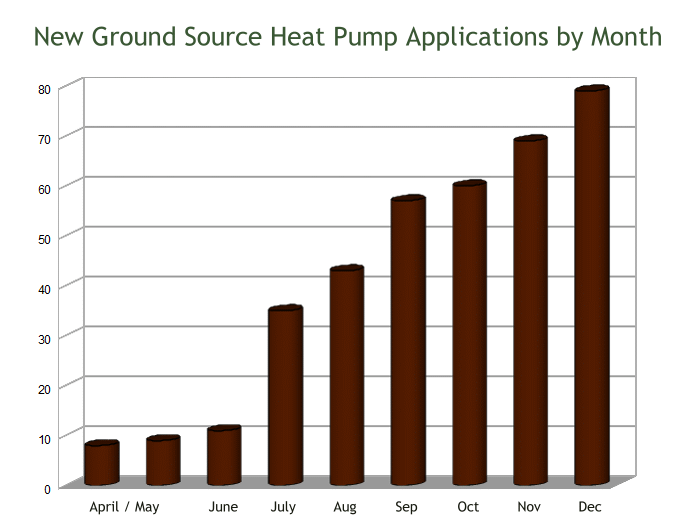 Of all the Domestic RHI technologies, ground source heat pumps have seen the lowest installation numbers. But in a hare and tortoise like story, ground source heat pumps continue their stubborn and steady growth through December.
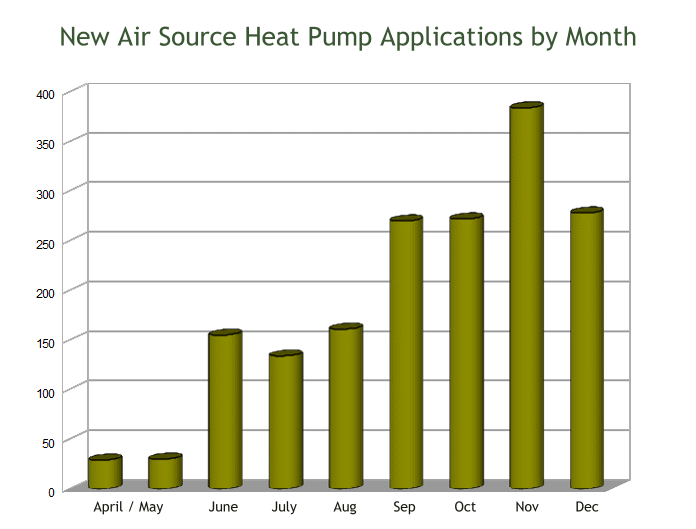
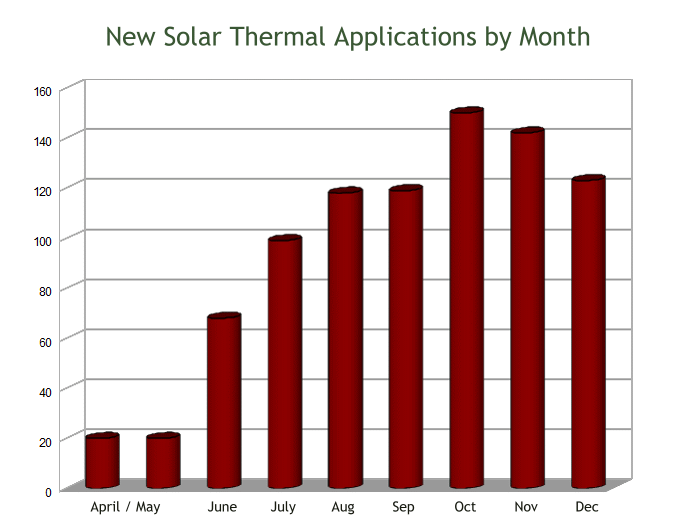
Air Source and Solar Thermal Take a Christmas Break
December saw a downswing in installations of both solar thermal and air source heat pumps. The general trend under the Domestic RHI still looks like growth for both technologies and a slow down in new applications in December is hardly surprising.
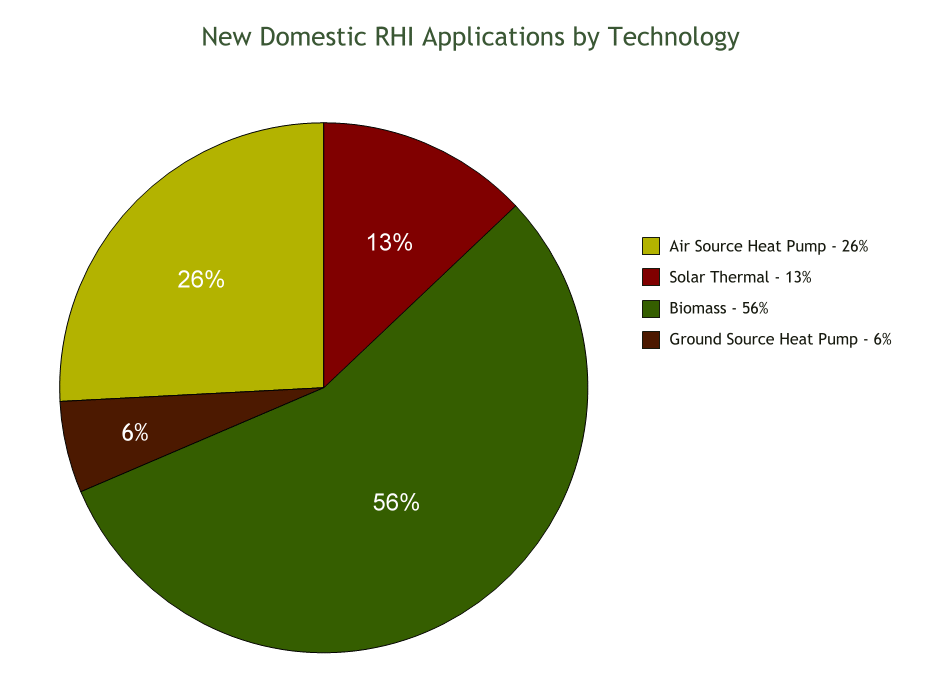
New Applications by Installed Technology
New applications are for systems installed since the launch of the scheme on 9th April 2014.
| Technology | Applications | Accreditations | ||
|---|---|---|---|---|
| Number | % | Number | % | |
| Air Source Heat Pump | 1,713 | 26% | 1,325 | 27% |
| Ground Source Heat Pump | 371 | 6% | 263 | 5% |
| Biomass | 3,690 | 56% | 2,667 | 53% |
| Solar Thermal | 859 | 13% | 743 | 15% |
| Total | 6,633 | 100% | 4,998 | 100% |
Total Applications by Installed Technology
Total applications include both new applications and legacy applications.
| Technology | Applications | Accreditations | ||
|---|---|---|---|---|
| Number | % | Number | % | |
| Air Source Heat Pump | 8,198 | 36% | 7,007 | 36% |
| Ground Source Heat Pump | 3,431 | 15% | 2,922 | 15% |
| Biomass | 6,420 | 28% | 5,187 | 27% |
| Solar Thermal | 4,706 | 21% | 4,193 | 22% |
| Total | 22,755 | 100% | 19,309 | 100% |
Our Domestic Renewable Heat Updates page is updated monthly with the latest figures, reports and graphs on domestic renewable heat activity in the UK and numbers from the Domestic RHI.
If you would like to find out more about the Domestic RHI, you might find our Domestic RHI Guide useful.
A Note on Graphs Images and Figures Used in this Update
This update is based on statistics released by DECC on the uptake of the Domestic RHI. If you wish to use graphs etc. from this update, you are free to do so and do not need specific permission. We would ask that you credit the source of the images by linking to this update.