
UK Domestic Renewable Heat Update – November 2014
Latest data available for the Domestic Renewable Heat Incentive covers the period from the launch of the scheme on April 9th 2014 to the end of October 2014. The Domestic Renewable Heat Incentive (Domestic RHI) is a UK Government scheme to encourage the use of renewable heating technologies. Under the scheme, householders receive quarterly payments for a period of 7 years based on the amount of renewable heat their system produces. Figures from the scheme show renewable heat installations in the UK continuing to grow.
Key Points From October 2014
Legacy Applications Continue to Dominate
The Domestic RHI has had 16,487 applications, to date and they continue to be dominated by legacy applications. Legacy applications are for systems installed prior to the launch of the scheme on April 9th 2014 and account for 80.42% (13,259) of applications to date. Only 19.58% (3,228) of applications are for installations that took place since the launch of the scheme. It is new applications that give us an indication of current activity in the renewable heat market.
New Installations Continue to Grow Month on Month
The number of installations applied for under the scheme have been increasing month on month after an understandably slow start. This trend continued in October for the 6th month running.
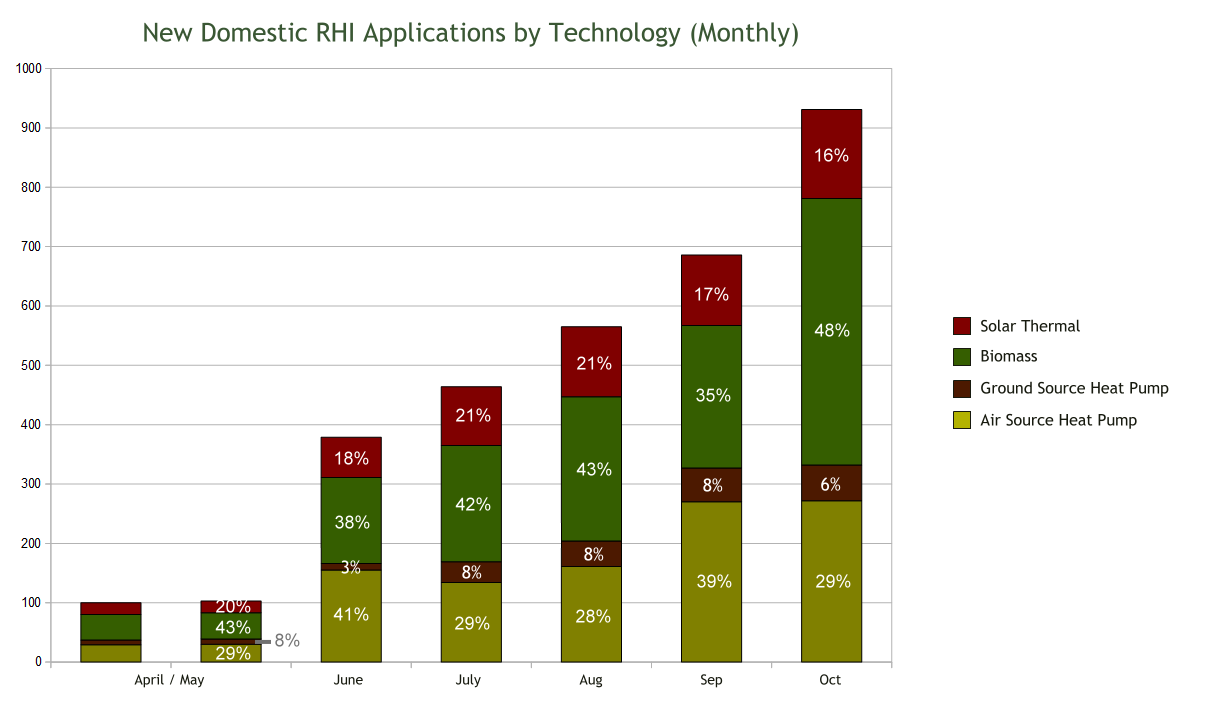
October Installations Up 35.71% on September
There were 931 new installations in October, the biggest month to date and 35.71% up on September which was previously the busiest month.
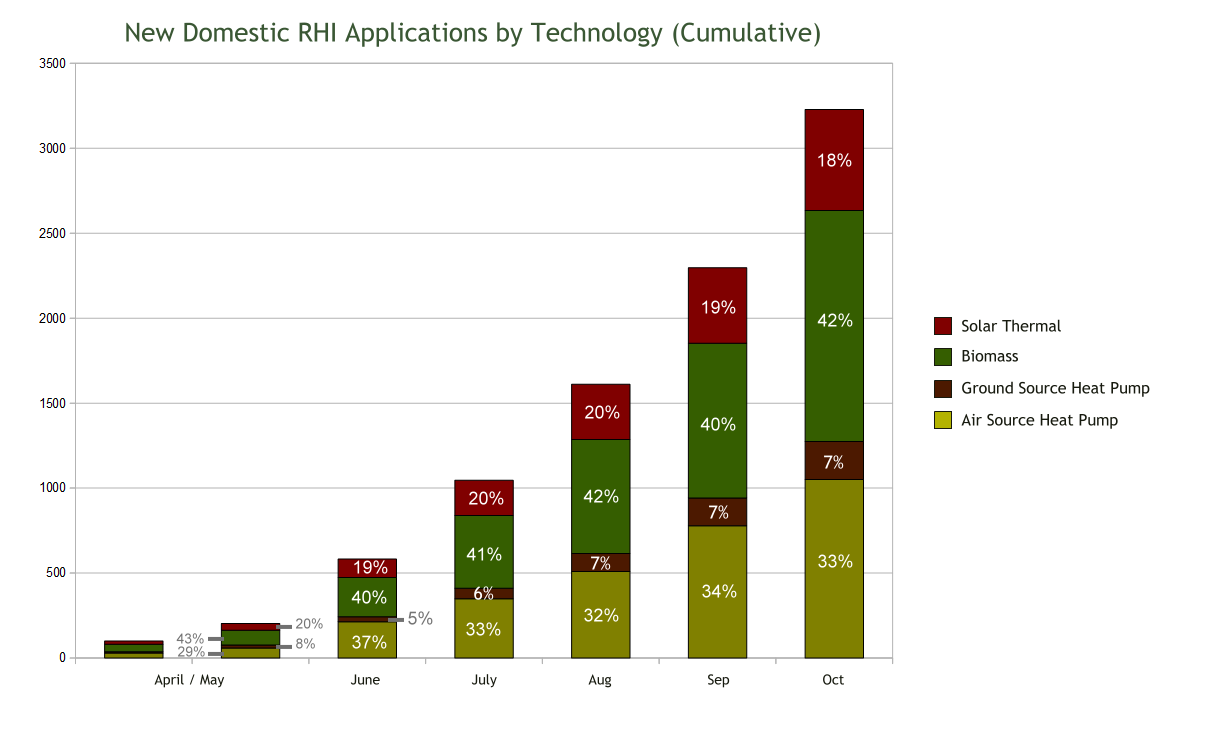
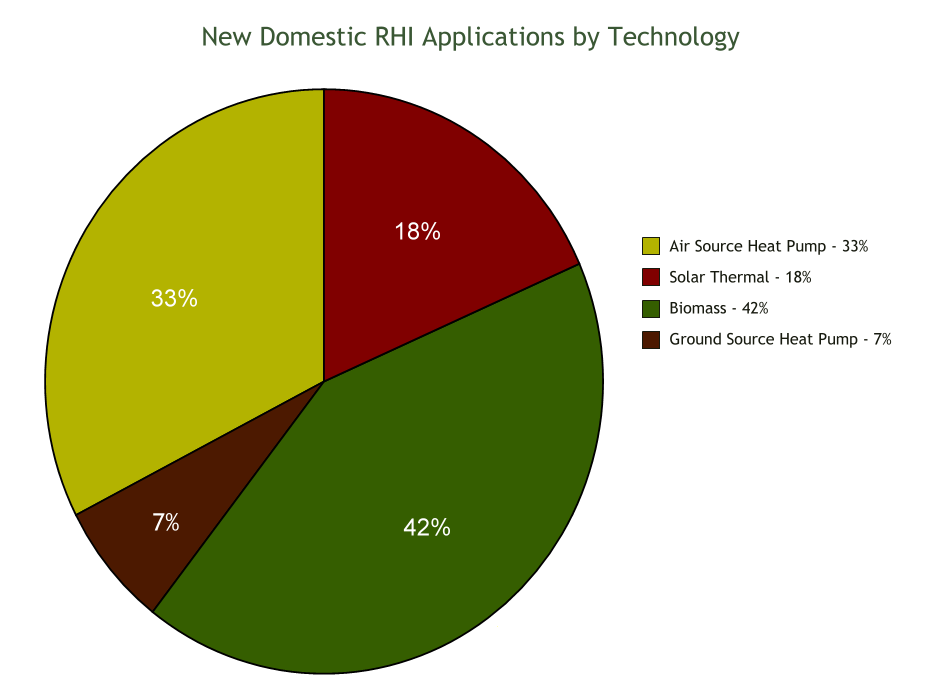
Biomass Accounts for the Largest Share of New Installations
Biomass has accounted for 42% of new installations since the launch of the scheme on 9th April. This is a big increase when compared to the share biomass achieved in recent years. Biomass continues to do very well from the Domestic RHI.
October a Good Month for Biomass
 Biomass has been the most popular technology since the launch of the domestic RHI and accounts for 42% of new installations under the scheme. October was a particularly strong month for biomass after new installation numbers actually took a slight fall in September. October saw 449 new biomass installations which is nearly double the 240 achieved in September.
Installation Numbers for All Technologies Grew in October
Although the technology mix is changing from month to month and the percentage share of biomass or air source has gone up and down in various months, it is important to note that all technologies are growing month on month. Every technology covered by the domestic RHI saw some month on month growth from September to October. Although some technologies seem to be more popular than others, new installations of every technology have been rising since the start of the scheme.
New Applications by Installed Technology
New applications are for systems installed since the launch of the scheme on 9th April 2014.
| Technology | Applications | Accreditations | ||
|---|---|---|---|---|
| Number | % | Number | % | |
| Air Source Heat Pump | 1,051 | 33% | 753 | 31% |
| Ground Source Heat Pump | 223 | 7% | 135 | 6% |
| Biomass | 1,360 | 42% | 1,031 | 43% |
| Solar Thermal | 594 | 18% | 483 | 20% |
| Total | 3,228 | 100% | 2,402 | 100% |
Total Applications by Installed Technology
Total applications include both new applications and legacy applications.
| Technology | Applications | Accreditations | ||
|---|---|---|---|---|
| Number | % | Number | % | |
| Air Source Heat Pump | 6,289 | 38% | 4,954 | 37% |
| Ground Source Heat Pump | 2,641 | 16% | 2,050 | 15% |
| Biomass | 3,690 | 22% | 3,062 | 23% |
| Solar Thermal | 3,867 | 23% | 3,261 | 24% |
| Total | 16,487 | 100% | 13,327 | 100% |
Our Domestic Renewable Heat Updates page is updated monthly with the latest figures, reports and graphs on domestic renewable heat activity in the UK and numbers from the Domestic RHI.
If you would like to find out more about the Domestic RHI, you might find our Domestic RHI Guide useful.
A Note on Graphs Images and Figures Used in this Update
This update is based on statistics released by DECC on the uptake of the Domestic RHI. If you wish to use graphs etc. from this update, you are free to do so and do not need specific permission. We would ask that you credit the source of the images by linking to this update.