
The Feed in Tariff scheme was introduced on April 1 2010 as a support for small scale renewable electricity generation. The scheme is open to both domestic and business users and covers technologies such as Solar PV, Wind, Hydro, CHP and Anaerobic Digestion. Installations must be below 5 MW in generation capacity.
The basic structure of the Feed in Tariff scheme is that qualifying installations are paid for each kWh of electricity they generate. This includes the electricity they use themselves. They are paid an extra “export” rate for any electricity produced which is not used on site but exported back to the grid.
This report analyses Feed in Tariff data on confirmed installations for the first 3 years of the scheme (April 2010 to March 31st 2013). The data analysed is based on confirmation date data from Ofgem’s Renewables & CHP Register.
Sections
Summary
Total Installed Capacity
Breakdown by Technology
Renewable Growth Through FIT
Average Installed Capacity by Technology
Commercial vs Domestic Installations
Summary
A total of 379,511 installations have been registered under FIT as at the 31st March 2013. These installations have a total generating capacity of 1792.32 MW. Solar PV is the dominant technology under the scheme accounting for 98.55% of all installations and 88.45% of generated capacity. The vast bulk of installations under the Feed in Tariff are domestic. Although lower in numbers, commercial installations tend to have a larger generation capacity and contribute significantly to capacity. Similarly, technologies like wind and anaerobic digestion are not matching solar in the numbers but their higher average capacity and steady performance make them a significant part of the picture.
Total Installed Capacity
Total installed capacity under FIT is now 1792.32 MW.
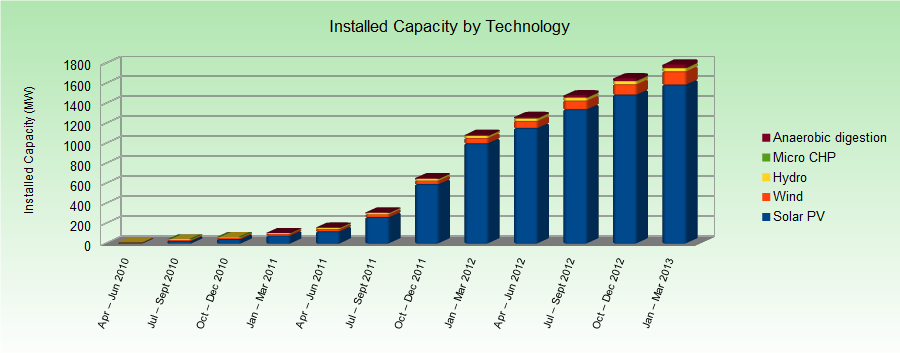
Breakdown by Technology
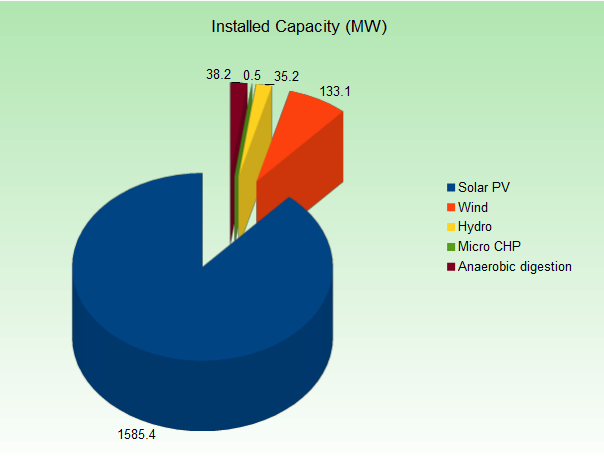 Solar PV is the dominant technology in the Feed in Tariff scheme both in terms of the number of installations and installed capacity. To date, solar PV accounts for 98.55% of all installations under FIT (374,014) and 88.45% (1585 MW) of the capacity introduced through the scheme. Wind is in second place with 4,644 installations and 133 MW of installed capacity.
Number of Installations
| Solar PV | Wind | Hydro | Micro CHP | Anaerobic digestion | Total | |
|---|---|---|---|---|---|---|
| Apr – Jun 2010 | 2,692 | 59 | 4 | 0 | 0 | 2,755 |
| Jul – Sept 2010 | 7758 | 610 | 106 | 5 | 0 | 8,479 |
| Oct – Dec 2010 | 6,643 | 319 | 46 | 17 | 2 | 7,027 |
| Jan – Mar 2011 | 11,350 | 314 | 44 | 79 | 1 | 11,788 |
| Apr – Jun 2011 | 14,522 | 183 | 12 | 58 | 2 | 14,777 |
| Jul – Sept 2011 | 35,401 | 330 | 16 | 97 | 5 | 35,849 |
| Oct – Dec 2011 | 66,006 | 238 | 12 | 68 | 4 | 66,328 |
| Jan – Mar 2012 | 100,226 | 360 | 23 | 34 | 2 | 100,645 |
| Apr – Jun 2012 | 37,140 | 476 | 31 | 15 | 5 | 37,667 |
| Jul – Sept 2012 | 43,658 | 452 | 35 | 30 | 9 | 44,184 |
| Oct – Dec 2012 | 27,980 | 734 | 16 | 20 | 7 | 28,757 |
| Jan – Mar 2013 | 20,638 | 569 | 19 | 18 | 11 | 21,225 |
| Total | 374,014 | 4,644 | 364 | 441 | 48 | 379,511 |
Installed Capacity (MW)
| Solar PV | Wind | Hydro | Micro CHP | Anaerobic digestion | Total | |
|---|---|---|---|---|---|---|
| Apr – Jun 2010 | 6.66 | 5.25 | 3.27 | 0 | 0 | 15.18 |
| Jul – Sept 2010 | 19.48 | 5.13 | 3.75 | 0.01 | 0 | 28.36 |
| Oct – Dec 2010 | 18.51 | 2.82 | 1.7 | 0.02 | 0.67 | 23.73 |
| Jan – Mar 2011 | 32.83 | 5.41 | 1.08 | 0.08 | 1.1 | 40.50 |
| Apr – Jun 2011 | 43.66 | 5.22 | 2.91 | 0.06 | 3.19 | 55.05 |
| Jul – Sept 2011 | 142.41 | 3.93 | 2.57 | 0.1 | 3.85 | 152.85 |
| Oct – Dec 2011 | 329.55 | 6.74 | 2.72 | 0.07 | 2.81 | 341.90 |
| Jan – Mar 2012 | 406.02 | 20.01 | 3.79 | 0.03 | 2.07 | 431.92 |
| Apr – Jun 2012 | 154.67 | 16.03 | 3.72 | 0.02 | 4.01 | 178.44 |
| Jul – Sept 2012 | 186.04 | 17.02 | 5.14 | 0.03 | 9.12 | 217.35 |
| Oct – Dec 2012 | 147.17 | 14.23 | 3.55 | 0.02 | 4.56 | 169.53 |
| Jan – Mar 2013 | 98.37 | 31.36 | 0.96 | 0.02 | 6.8 | 137.51 |
| Total | 1,585.38 | 133.14 | 35.17 | 0.45 | 38.18 | 179.32 |
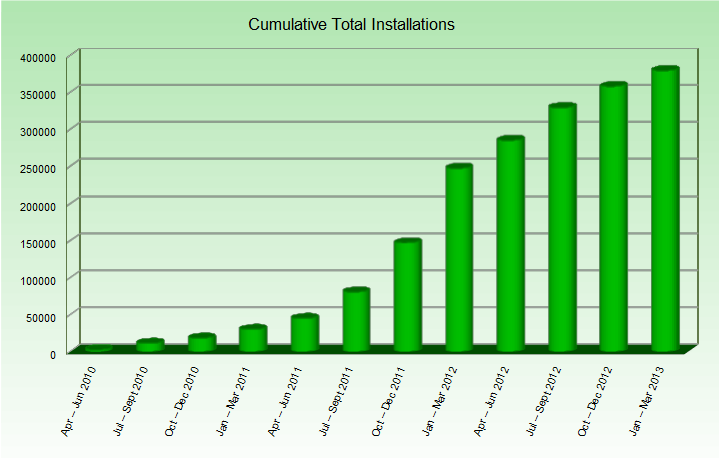
Renewable Growth Through FIT
Data from the Feed in Tariff scheme continues to show growth in the renewable technologies covered by the scheme. Reductions in the Feed in Tariff for solar PV from April 2012 created a concentration of installations in the run up to the deadline and a moderated growth rate for solar PV under the new, lower tariff. Solar PV accounts for such a large share of FIT installations that this effect can clearly be seen in the figure below.
When considering total installed capacity, the same effect can be seen but is less extreme. The upward trend in installed capacity is markedly more stable than that in number of installations.
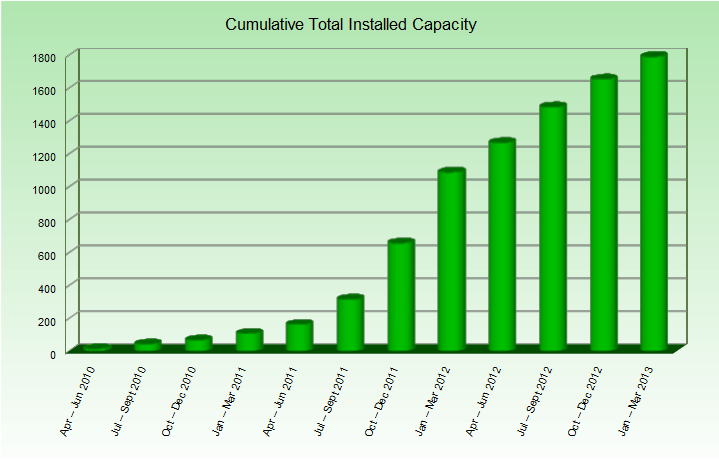
This reflects a larger average capacity and decent growth from technologies which tend to have a higher average generation capacity (wind, hydro, anaerobic digestion).
Average Installed Capacity by Technology
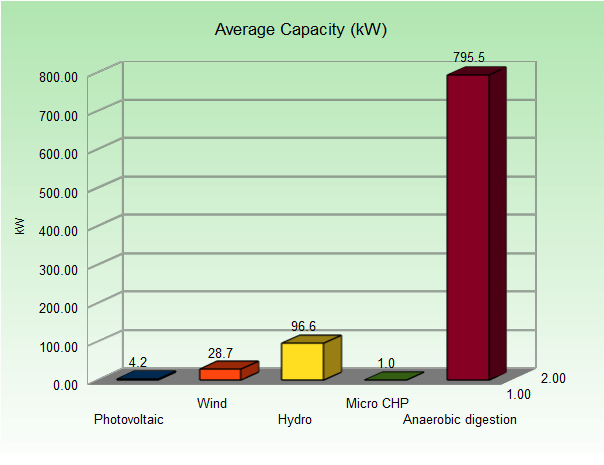
Solar PV accounts for the bulk of activity under FIT and the bulk of capacity but on average, solar PV installations have a lower capacity than the other technologies. The overall average capacity for FIT installations across all technologies is 4.72 kW. The breakdown by technology is as follows:
| Average Capacity per Installation (kW) | |
|---|---|
| Photovoltaic | 4.24 |
| Wind | 28.67 |
| Hydro | 96.61 |
| Micro CHP | 1.02 |
| Anaerobic digestion | 795.48 |
Domestic vs Commercial Installations
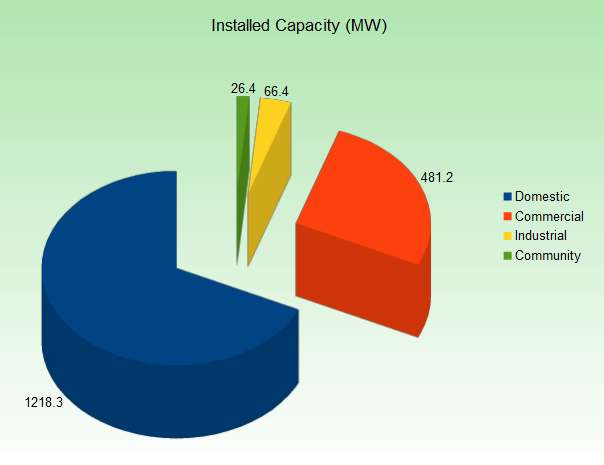
Over the course of the 3 years, the Feed in Tariff scheme has seen 379,511 installations. Of these, 366,461 (96.56%) have been domestic. Domestic installations also account for the largest share of the installed capacity under the scheme, 1218.30 MW or 67.97%. Commercial installations have the second largest share with 10,562 installations accounting for 481.15 MW of installed capacity.
| Installed Capacity (MW) | |
|---|---|
| Domestic | 1218.30 |
| Commercial | 481.15 |
| Industrial | 66.42 |
| Community | 26.45 |